Homework Streaming Large Text File
- calculate summary statistics from a data stream
- use pipelines to process a file larger than memory
Announcements
- The question “How much longer does X take than Y” is usually most useful when answered in relative terms. For example, if the transfer took 1.9 seconds, and now it takes 79.2 seconds, then say that the second way is 79.2/1.9 = 42 times slower than the first.
- Check for comments / feedback on skills assignments.
- will post skills assignment solutions next week.
123 GO - what was the last kind of physical exercise you did?
Resources
- blog post streaming with S3
Background
The GDELT Project is the Global Database of Events, Language, and Tone. It describes itself as:
A Global Database of Society. Supported by Google Jigsaw, the GDELT Project monitors the world’s broadcast, print, and web news from nearly every corner of every country in over 100 languages and identifies the people, locations, organizations, themes, sources, emotions, counts, quotes, images and events driving our global society every second of every day, creating a free open platform for computing on the entire world.
The events from 2018 are available in a single file at the S3 URI s3://stat196k-data-examples/2018.csv.gz.
This file is 3.8 GB, compressed.
Here are the column definitions.
Goldstein Score
Each CAMEO event code is assigned a numeric score from -10 to +10, capturing the theoretical potential impact that type of event will have on the stability of a country. This is known as the Goldstein Scale. This field specifies the Goldstein score for each event type. NOTE: this score is based on the type of event, not the specifics of the actual event record being recorded‚ thus two riots, one with 10 people and one with 10,000, will both receive the same Goldstein score. This can be aggregated to various levels of time resolution to yield an approximation of the stability of a location over time.
I believe this is the CAMEO event code mapping to goldstein scores.
Assignment
Turn in two files:
- A PDF or HTML document containing your answers to the following questions in a neatly organized report.
- A file with extension
.sh.txtshowing all the code necessary to reproduce your work. The.shis for shell script, and this is normally the only extension you need. The.txtallows Canvas to render it as plain text in the web browser, so I can grade it.
I suggest you use markdown through something like pandoc, Rmarkdown, or Jupyter notebooks to create your report. The markdown source for the assignment is on Github, so you can copy and paste from there. MS Word and other GUI programs should work fine too.
Questions
1 - subset
5 pts
Download a small subset of the data (100 rows is plenty) to your personal computer, and examine it using any software you like. Briefly describe this subset of the data by picking out a couple rows that look interesting to you.
- How many columns are there?
- Do the data values in each column seem to match the column definitions?
- What character delimits the records?
- What is the CAMEO event code, what event does this correspond to, and what is the Goldstein score?
- Are the URL’s to the news articles still live, and do they match the CAMEO event code?
- Does the Goldstein score appear to be doing what it was designed to do?
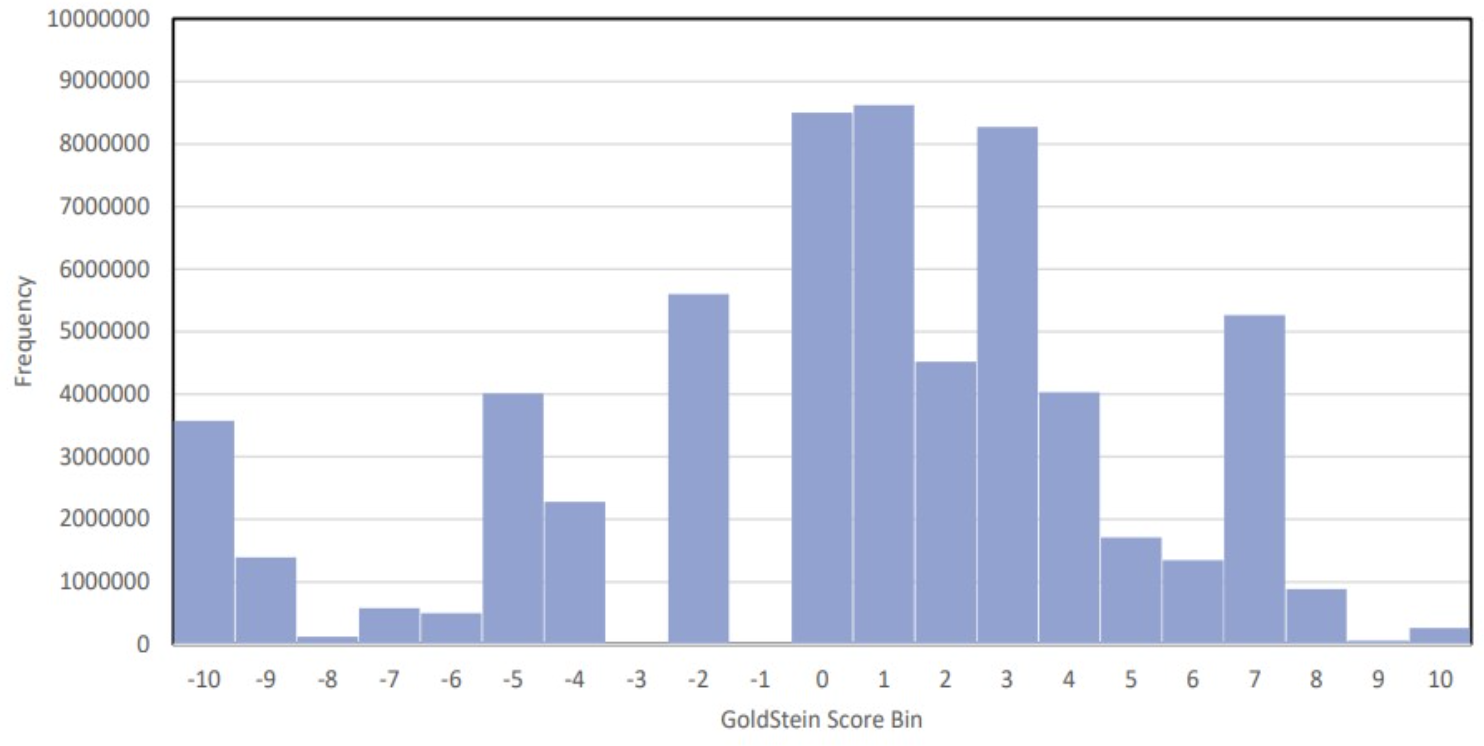
2 - histogram
10 pts
Create a histogram of the Goldstein scores for all of 2018, using the integers as bin endpoints for the histogram. It’s possible to do this in less than 10 minutes using a single shell pipeline on a t2 micro instance with 1 vCPU, 1 GiB memory, and 8 GiB storage.
- How long does your program take to run?
- Explain in detail what each command in the pipeline does and how they work together.
- Plot and interpret the histogram. You’ll probably want to download the summary statistics (around 20 numbers) to your personal computer to plot the histogram. Do you notice anything strange?
- Exactly how many events (rows) are in this data?
3 - performance
5 pts
Print and interpret the output of top while your program is running.
- What are the bottlenecks?
- Run and time your program on an EC2 instance with more vCPU’s and a faster network and show the results of
toponce more. Is the program faster on the more expensive instance? - Are you benefitting from pipeline parallelism?
- What’s the bottleneck now?
- Compare and comment on the financial cost of using a more expensive instance versus the t2.micro. Is it worth it?
Remember to terminate these more expensive machines immediately after you use them! Otherwise, you may quickly run through your $50 credit and have to spend your own money. AWS Services Supported says that our Educate accounts can only use these kinds of instances: “t2.small”, “t2.micro”, “t2.nano”, “m4.large”, “c4.large”, “c5.large”, “m5.large”, “t2.medium”, “m4.xlarge”, “c4.xlarge”, “c5.xlarge”, “t2.2xlarge”, “m5.2xlarge”, “t2.large”, “t2.xlarge”, “m5.xlarge”.
4 - Extra Credit Challenge
0 pts, optional
Starting with the same 3.8 GB file on S3, calculate the summary statistics necessary for the histogram as fast as possible. You can use the shell or any other programming language together with any EC2 instance available through your AWS Educate account. Hint: look into software like GNU parallel and pigz. Turn in any extra code you write. The student with the fastest program gets a minimal amount of extra credit and a maximal amount of glory.
Brian Kernighan Explains Shell Pipelines
Watch until 10:50.
Feedback
Why does the histogram look like this? Why is there nothing in some bins, and many in adjacent bins? Shouldn’t this data be continuous?
We say a program is:
- CPU bound (CPU = central processing unit) if the CPU speed prevents the program from being faster.
- I/O bound (I/O is input/output) if the rate at which data arrives at the CPU prevents the program from being faster.
We can determine when a program is CPU bound by observing how busy the processors are, for example, with top.
In shell pipelines, there are a couple ways a program can be CPU bound:
- Bottleneck If one step in the pipeline uses 100% of a processor, then that step is a true bottleneck. The program won’t go any faster until you make that bottleneck go faster, regardless of whether you have 2 CPU’s or 100 CPU’s.
- Max out all processors If the processes in a pipeline cumulatively use all the available CPU capacity, but no process is at 100%, then you’ve maxed out all the processing power. For example, if you have 2 CPU’s, and 3 processes in a shell pipeline at 75%, 50%, and 74% CPU utilization, then you’ve cumulatively used 75 + 50 + 75 = 199% CPU, which is approximately all of the 200% available from the 2 CPU’s. Adding CPU’s will make it faster, up until one process becomes a bottleneck, or the program becomes I/O bound.
If a shell pipeline is not CPU bound, then it’s I/O bound, or else there’s something weird going on.
In this assignment, when we switched to bigger, better machines, the program which was CPU bound became I/O bound, and didn’t go all that much faster for most of you.
In other words, the aws s3 command only delivers data to a particular type of instance at a certain rate, and you’ll never be able to process data faster than that.
How to make it faster then?