Outline
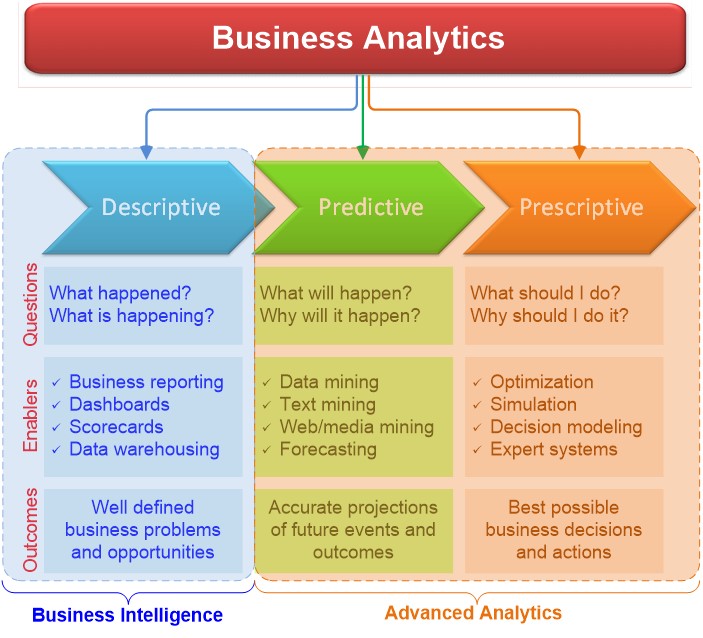
- What is Business Analytics?
- Descriptive Analytics
- Predictive Analytics
- Digital Analytics
- Prescriptive Analytics
- Emerging Trends
Many of these slides adapted from two Business Analytics textbooks by Sharda, Delen, and Turban, Pearson Education, Inc.
1. What Is Business Analytics?
2007, Competing on Analytics: The New Science of Winning2014, Germany's 12th Man at the World Cup: Big Data

Why did Germany win 2014 World Cup?
- 12th Man: Match Insights, an Analytics tool.
- SAP's Match Insights tool only available to the German team
- To gain a competitive edge, the team partnered with German software giant SAP AG to create a custom match analysis tool that collects and analyzes massive amounts of player performance data.
- Match Insights analyzes video data from on-field cameras capable of capturing thousands of data points per second, including player position and speed.
- That data then goes into an SAP database that runs analytics and allows coaches to target performance metrics for specific players and give them feedback via their mobile devices.
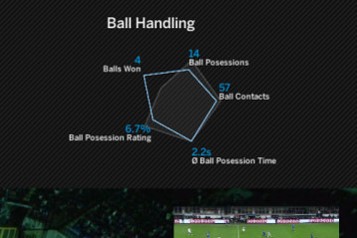
Why did Germany win 2014 World Cup?
- A focus for the German team this year was speed, said Nicolas Jungkind, SAP's head of soccer sponsorships.
- Using Match Insights, the team was able to analyze stats about average possession time and cut it down from 3.4 seconds to about 1.1 seconds.
- The tool allowed them to identify and visualize the change and show it to coaches, players and scouts.
- The tool also allowed the German coaches to determine performance indicators for individual players, which they can then send to teammates' mobile devices.
- The tool gave the German coaches in Brazil the ability to crawl through complex video and make it simple for them to know what they need to win.
Virtual "Defensive Shadows"
History of "Analytics"
- Charles Barkley rants about analytics
- In sports, statistics are often referred to as "analytics"
- Oakland (California) Athletics baseball team in late 1990s and early 2000s
- Mondayball: The Art of Winning an Unfair Game (book, movie)
- Billy Beane: how to win in the Major Leagues with a very small budget
- Hire affordable players based on statistical data
New Business Environments and Analytics
- Growing hardware, software, and network capabilities
- Powerful communication and collaboration tools
- Better data management
- Giant data warehouse and "Big Data"
- More powerful analytical tools and support
- Overcome human cognitive limits in processing and storing information
- Anywhere, anytime support
Business Intelligence (BI)
- An umbrella term that combines architectures, tools, databases, analytical tools, applications, and methodologies
- Descriptive analytics tools and techniques (i.e., reporting tools)
- Used to describe the early stages of business analytics, i.e., descriptive analytics.
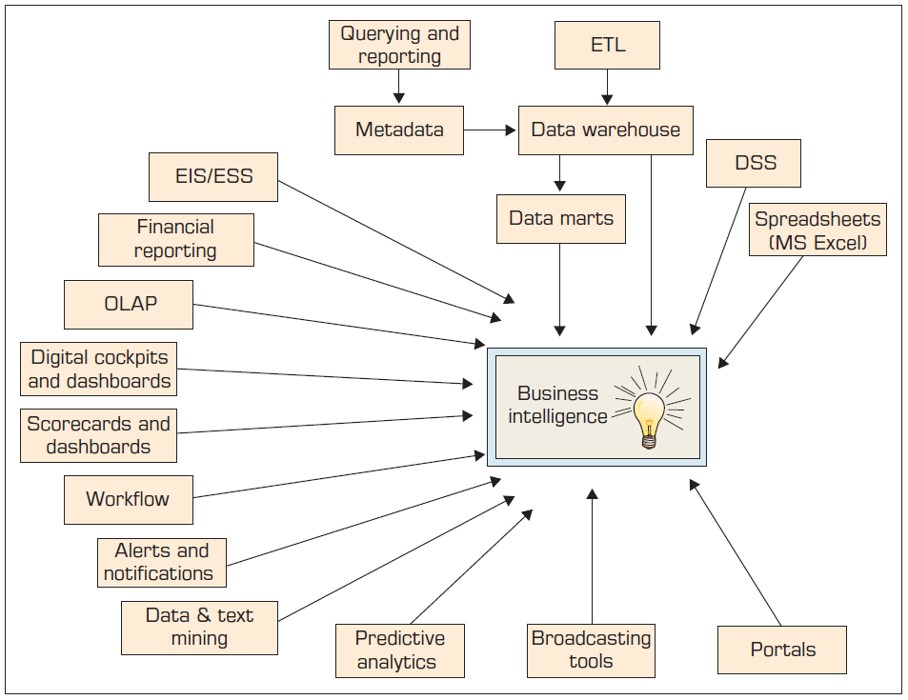
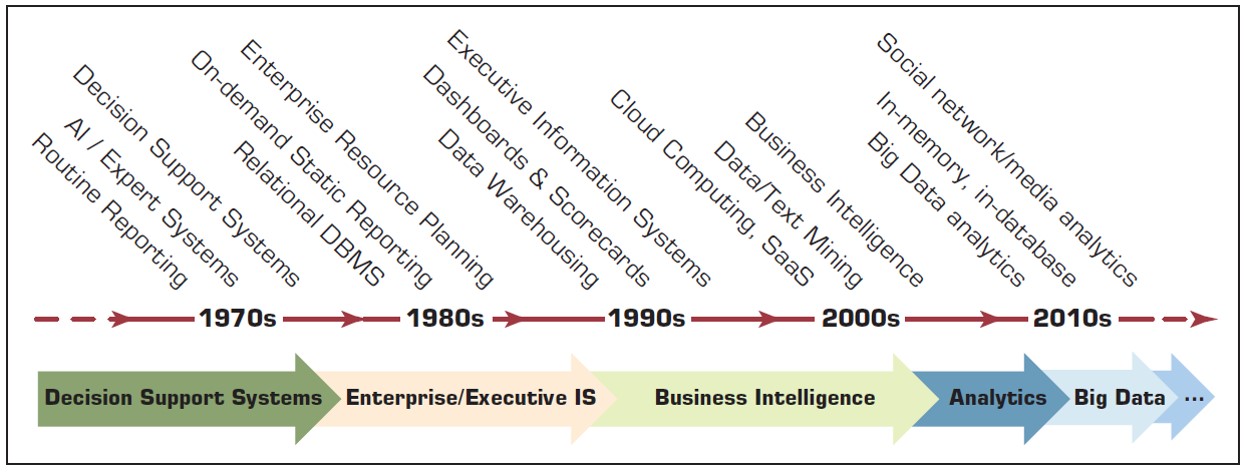
- Origins and Drivers of BI (see picture), Architecture of BI (see picture)
- Data Warehouse (DW) - middle data tier, repository to support business reporting and decision making; a distint system providing storage for data that will be used for analysis
- 2000s, DW-driven DSSs called BI systems
- BI has evolved into Business Analytics and Data Science
Origins and Drivers of BI
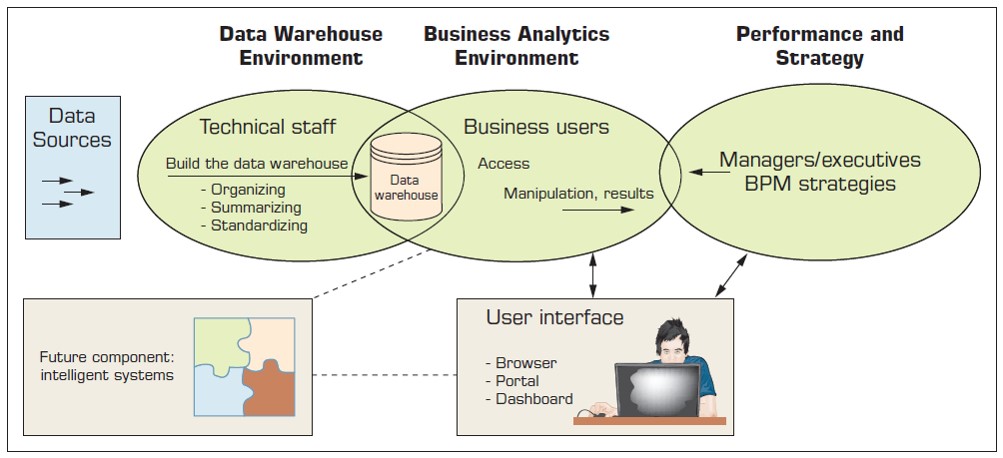
Architecture of BI
Evolution to Analytics/Data Science
Three Types of Analytics by INFORMS (Video)
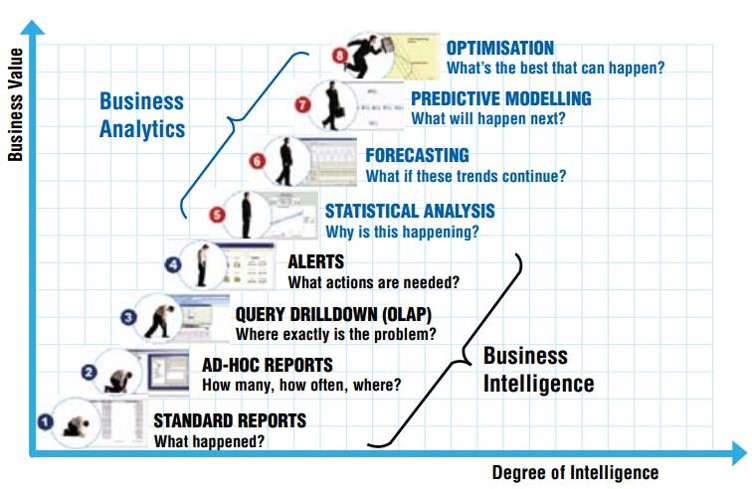
Eight Levels of Analytics - SAS
"Big Data"
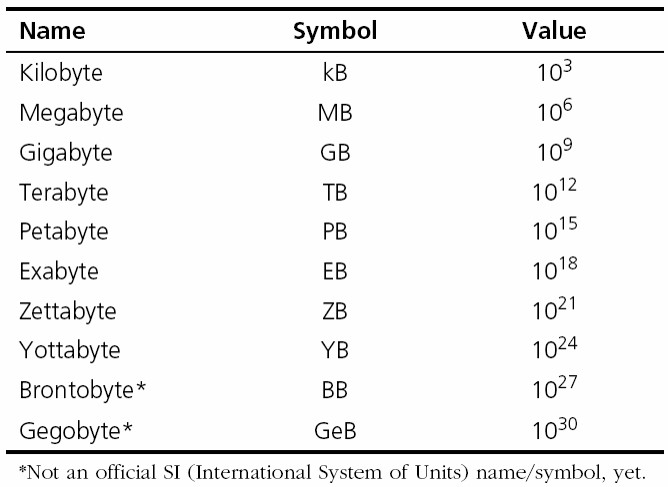
- Big Data come from everywhere: Web logs, RFID, GPS systems, sensor networks, social networks, Internet-based text documents, Internet search indexes, detail call records, astronomy, atmospheric science, biology, genomics, nuclear physics, biochemical experiments, medical records, scientific research, military surveillance, multimedia archives, etc. Every person online is generating 1.7 megabytes per second. YouTube generates 1 teribyte every four minutes and Facebook generates 500 teribytes per day. Can't be stored or processed easily using traditional tools/means.
- Vs that define Big Data: Volume, Variety, Velocity, Veracity, Variability, Value, etc.
- Big Data + "Big" Analytics = Value
- So much unstructured data arrive so fast! How to effectively and efficiently capture, store, and analyze Big Data? data volume, integration, processing capabilities, security, privacy, access skill availability (need data scientist).
Data Size Is Growing Faster and Faster
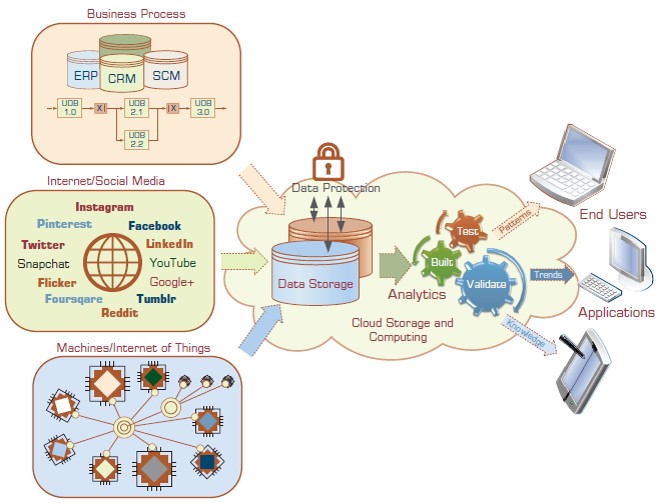
From Data to Knowledge
Are Data Ready for Analytics?
- Data source reliable?
- Data content accurate?
- Data accessible?
- Data security and data privacy?
- Data richness or comprehensiveness?
- Data consistency?
- Data currency/timeliness?
- Data granularity?
- Data relevancy?
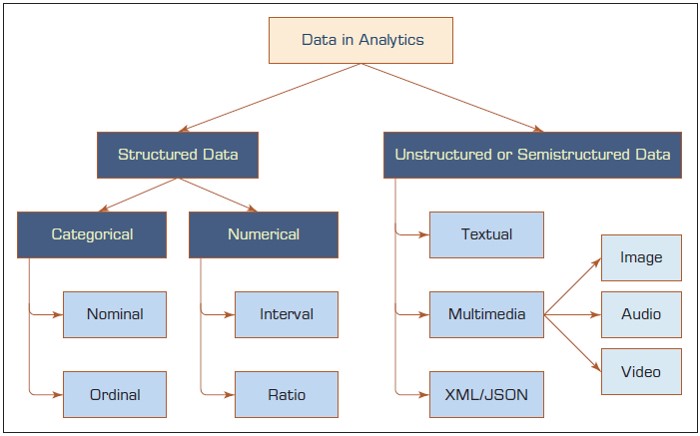
A Simple Taxonomy of Data
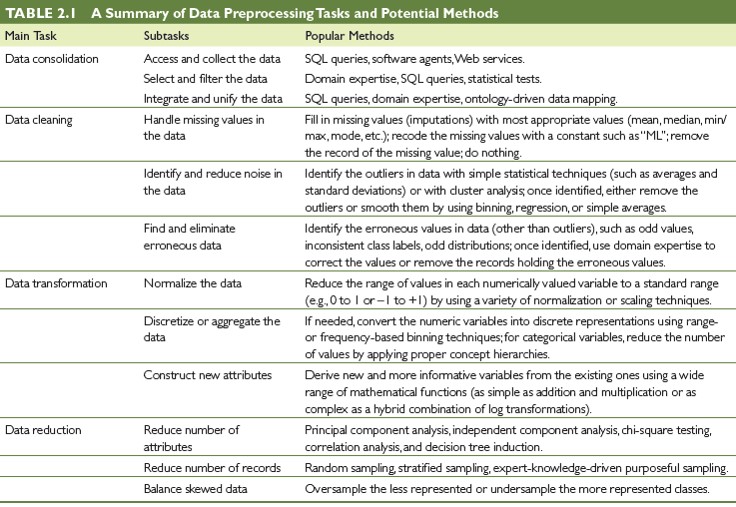
Data Preprocessing
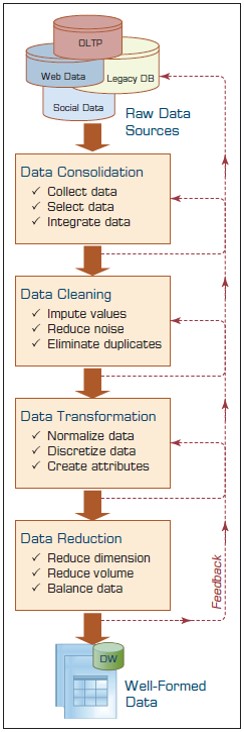
Data Preprocessing
Statistics for Business Analytics
Statistics Regaining Admiration
- Increasing popularity of business analytics
- Support evidence-based managerial decision making
- Attract business users in addition to statisticians and analytics professionals
- High Salary
- Descriptive statistics vs inferential statistics; classical statistics vs Bayesian statistics
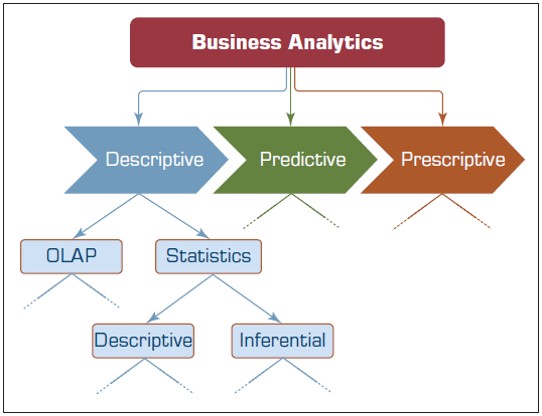
- OLAP (Business Intelligence), part of descriptive analytics, is about analyzing structured data in organizational databases (data warehouse or data mart)
- Statistics, part of both descriptive and predictive analytics, includes many advanced methods
Business Reporting
- The entry level in the business analytics taxonomy: Descriptive Analytics (OLAP, descriptive statistics)
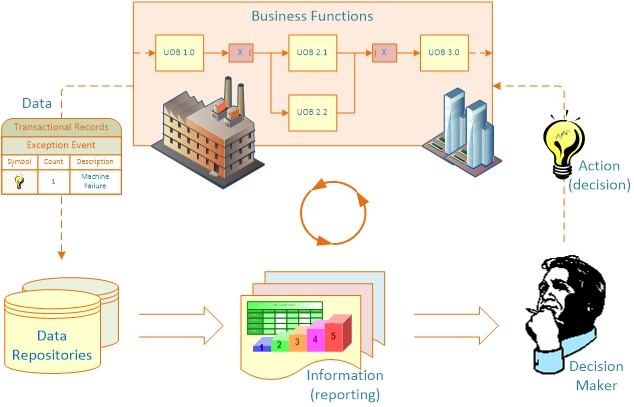
- Need information to make accurate and timely business decisions
- Information=contextualization of data
- Create reports to summarize business activities to answer "what happened?" and "what is happening?"
- Source of data: inside and outside the organization stored in a data warehouse
- Data warehouse is a collection of integrated, subject-oriented databases and contains data presenting a coherent picture of business conditions at one time.
Reporting in Business Decision Making
Business Reporting
- Involve ETL (extract, transform, and load) procedures and a data warehouse
- Software reporting tools, e.g., SAS Visual Analytics, SQL Server Reporting Services
- Three Types of Business Reports (often within a Business Performance Management, BPM)
- Metric Management (SLAs for externals, KPIs for internals, can be used as part of Six Sigma/TQM)
- Dashboard: represent several performance indicators using dials, gauges, etc.
- Balanced Scorecard (HBR 1992): financial, customer, business process, learning and growth indicators, etc.
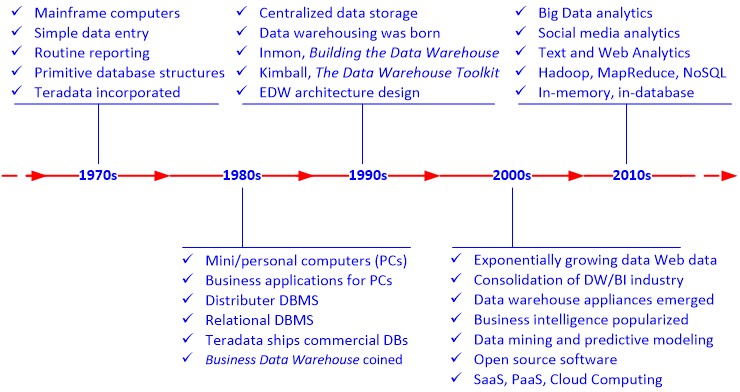
History of Data Warehousing
Three Types of Data Warehouses
- Data Marts - A departmental small-scale "DW" that stores only limited/relevant data
- Dependent data mart - A subset that is created directly from a data warehouse, using a consistent data model, providing quality data, same data for all users
- Independent data mart - A small data warehouse designed for a strategic business unit or a department, lower cost, scaled-down version of a data warehouse
- Operational Data Stores - interim staging area for a data warehouse and for short-term decisions involving mission-critical applications
- Enterprise Data Warehouses (EDW) - a large-scale data warehouse used across the enterprise for decision support
A Generic DW Framework
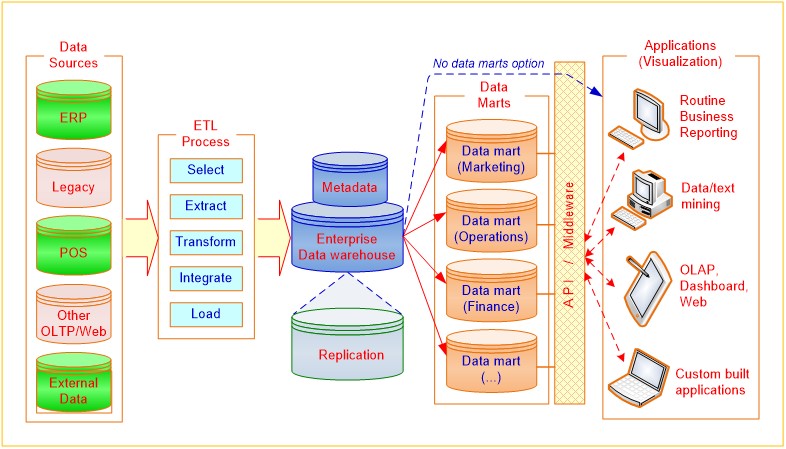
Extraction/Transformation/Load (ETL) Process
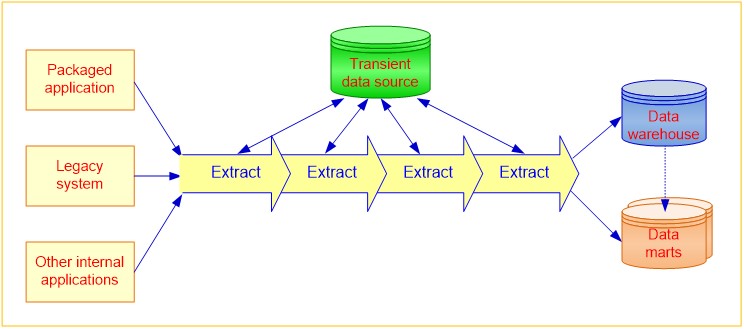
- The purpose of the ETL process: load the warehouse with integrated and cleansed data
- SAS offers the industry's first fully integrated solution tool that merges ETL and data quality
- Microsoft, Oracle, IBM, Informatica, Embarcadero, Tibco
Representation of Data in DW
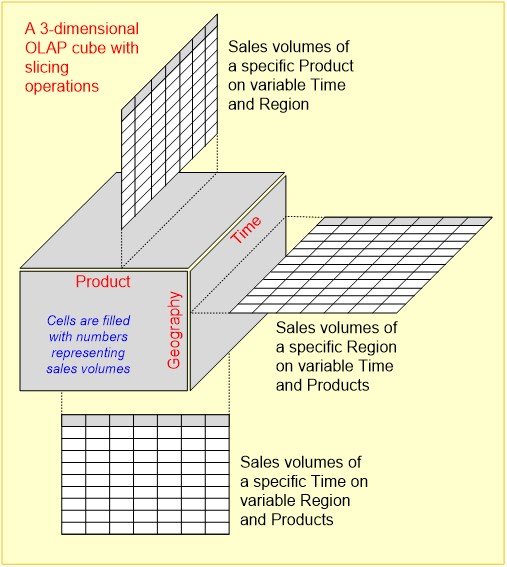
- Dimensional Modeling/Multidimensional presentation
- Dimensions (for filtering or slicing, grouping or dicing, and labelling data): products, salespeople, market segments, business units, geographical locations, distribution channels, country, or industry
- Measures: money, sales volume, head count, inventory profit, actual versus forecast
- Time: daily, weekly, monthly, quarterly, or yearly
- A fact (measurements or metrics) table is found at the center of a star schema or snowflake schema surrounded by (linked via foreign keys to) dimension tables
- An example and Tableau demo - left join Orders and Returns (join tables using SQL,SAS PROC SQL, Power BI, etc.)
Analysis of Data in DW
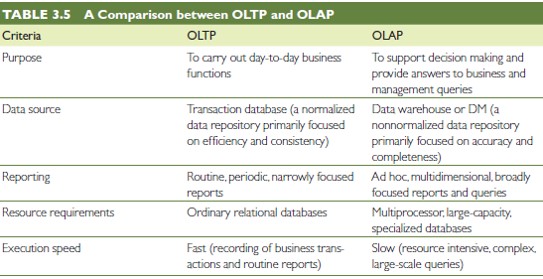
- OLTP (Online Transaction Processing)
- Capturing and storing data from ERP, CRM, POS, ...
- Must be efficient for routine tasks
- OLAP (Online Analytical Processing)
- Converting data into information for decision support
- Data cubes, drill down/up, slice & dice
- Requesting ad hoc reports and developing multimedia-based applications, etc.
- Conducting statistical and other analyses
OLAP vs. OLTP
OLAP Operations
- Slice - a subset of a multidimensional array
- Dice - a slice on more than two dimensions
- Drill Down/Up - navigating among levels of data ranging from the most summarized (up) to the most detailed (down)
- Roll Up - create subtotals which "roll up" from the most detailed level to a grand total
- Pivot - used to change the dimensional orientation of a report or an ad hoc query-page display
OLAP - Slice a 3-Dimensional Data Cube
Data (Information) Visualization
- "A picture is worth a thousand words."
- "Use visual representations to explore, make sense of, and communicate data."
- Information: aggregation, summarization, and contextualization of data or raw facts
- Related to information graphics, scientific visualization, and statistical graphics
- Charts, graphs, illustrations, etc.
- Data visualization dates back many centuries with most developments in the last 250 years
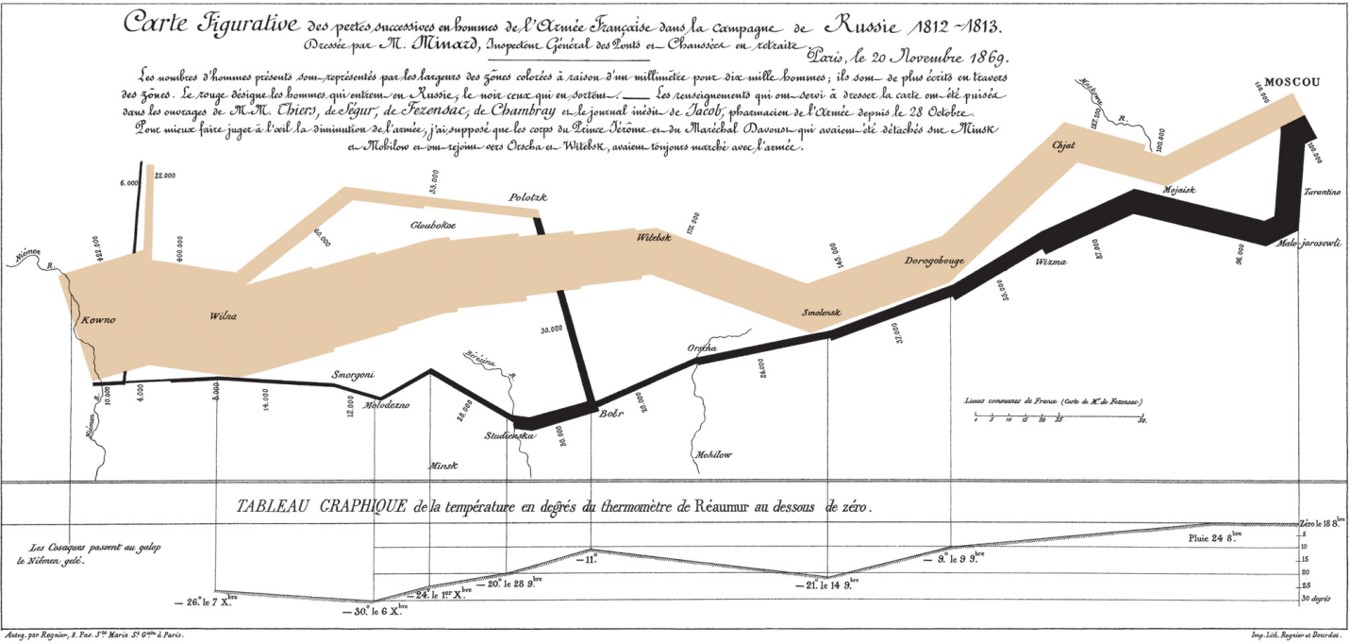
"The best Statistical Graphic Ever Drawn"
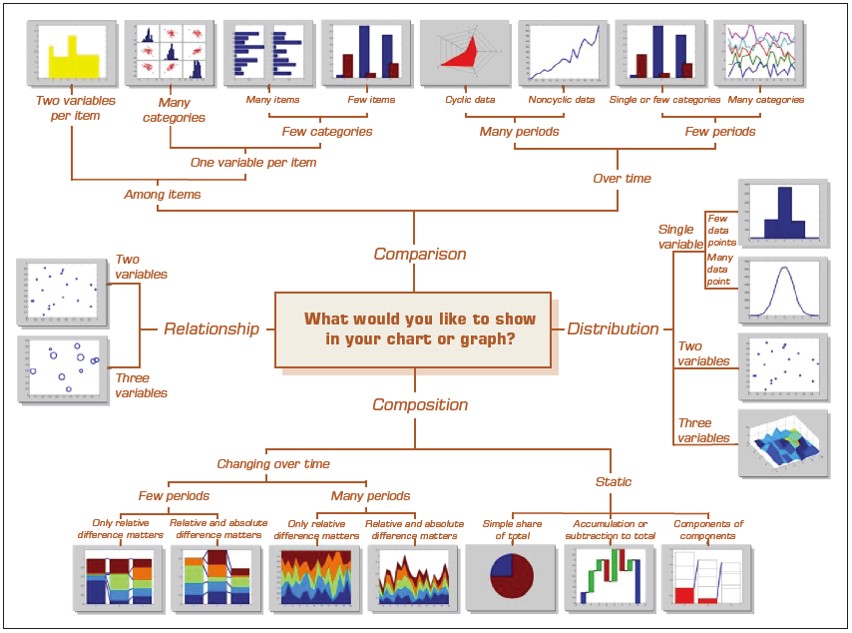
A Taxonomy of Charts and Graphs
Dashboards
- Dashboards provide visual displays of important information that is consolidated and arranged on a single screen so that information can be digested at a single glance and easily drilled in and further explored
- Performance dashboards in BPM software suites are used to monitor business performance
- Display all the required information on a single screen, clearly and without distraction, in a manner that can be assimilated quickly
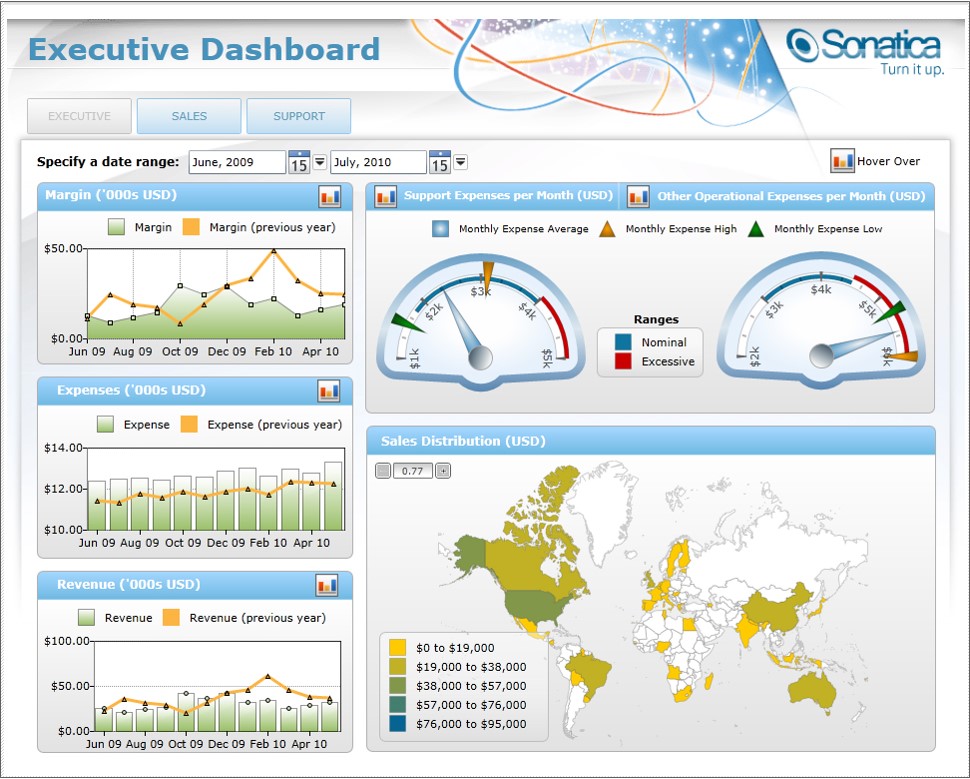
Executive Dashboard
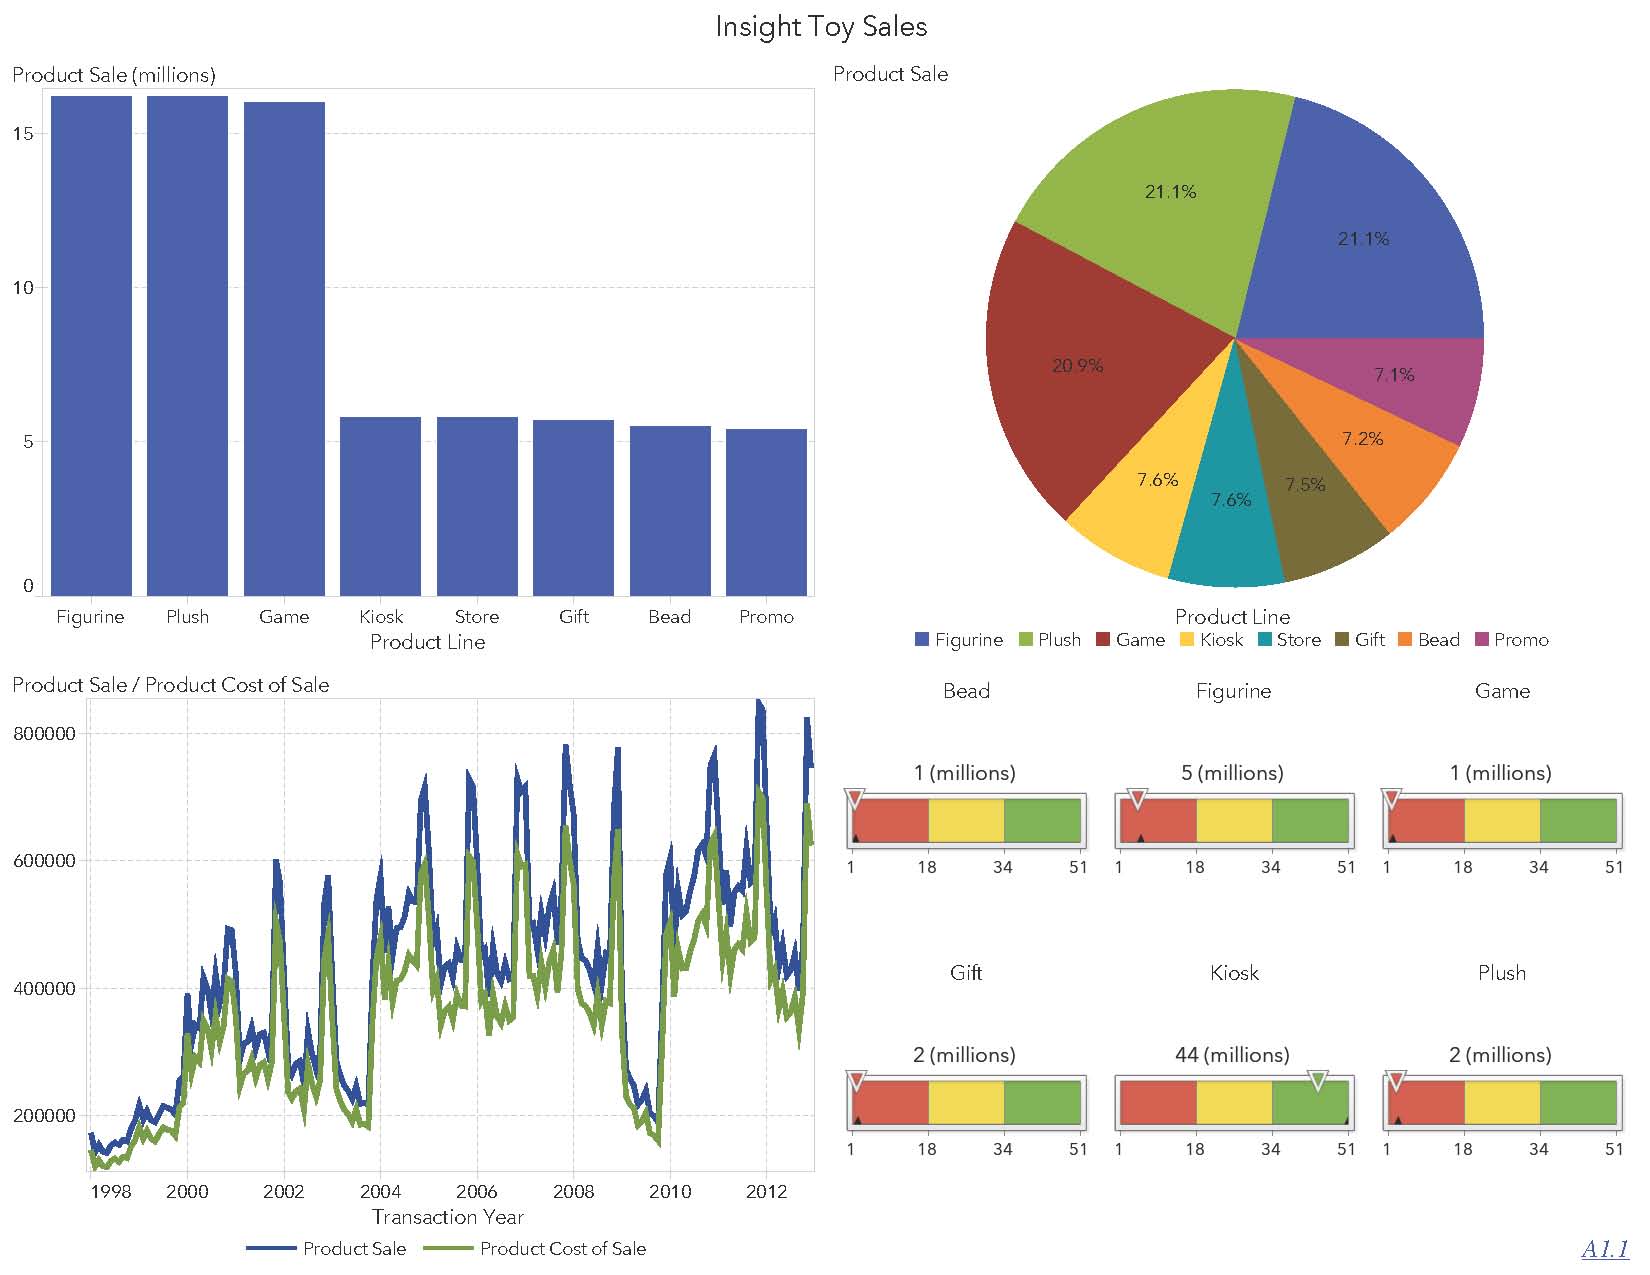
A Dashboard using SAS VA
Visual Analytics
- Information Visualization & Predictive Analytics
- Information visualization DESCRIBES "what happened" and "what is happening".
- Predictive analytics PREDICTS "what will happen" and "why will it happen".
- Visual analytics is gaining momentum!
- SAS Institute, a top analytics solution provider, released SAS Visual Analytics embedding analytics capabilities into a high-performance data visualization environment.
SAS Visual Analytics (VA)
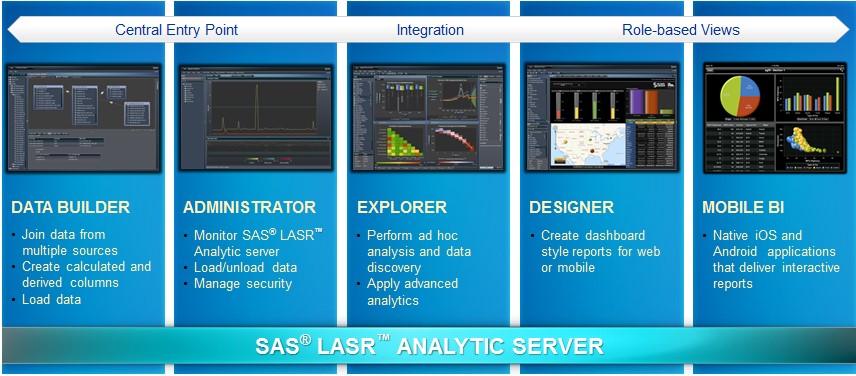
Big data, in memory, massively parallel processing, optimized, scalable, ...
Visual Analytics Demo
- SAS Visual Analytics (VA)
- SAS VA at Teradata University Network (TUN)
- SAS VA Video Tutorials
- Auto charting in Data Explorer
- Dashboard Style Report in Report Designer: Bar/Pie/Time Series Plot, Gauge (slider)
- Open-Source R
- R (also Microsoft R Products) provides strong graphic capabilities including a very powerful data visualization package called ggplot2 with its own grammar of graphics
- Prices of 50,000 round cut diamonds using R's ggplot2: "A Diamond Is Foreever"
Tableau
- Powerful business analytics and data visualization software
- Connect directly to data from your data warehouse for live up to date data analysis
- Perform queries without writing code
- Import data into Tableau's data engine from multiple sources and integrate
- Can be integrated with R for advanced analytics that Tableau cannot do (R is the industry standard for statistics and data mining, a powerhouse for Big Data analytics; open source but supported by companies like Microsoft)
- Versions: Desktop including Mac, Server, Online, Reader
An Example Using Tableau
- Global Superstore 2016 data and Tableau VA Example
- Plot Sales over Order Date
- Using "Marks"
- Shipping Cost vs Profit
- Adding dimensions: Category dimension to Color mark, Market dimension to Shape mark
- Replace "Category" by "Order Priority"
- Add Market dimension to Detail mark
- Highlighting
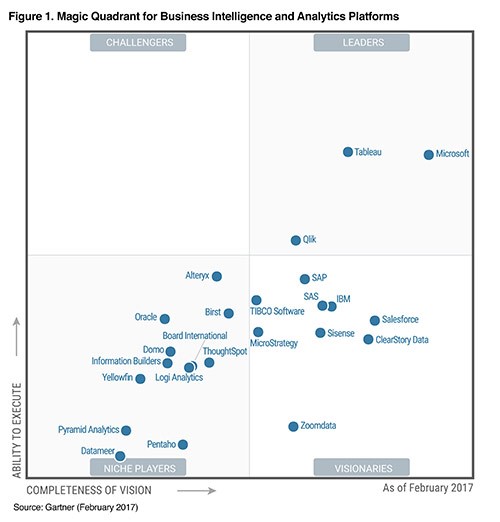
Magic Quadrant (Gartner.com)
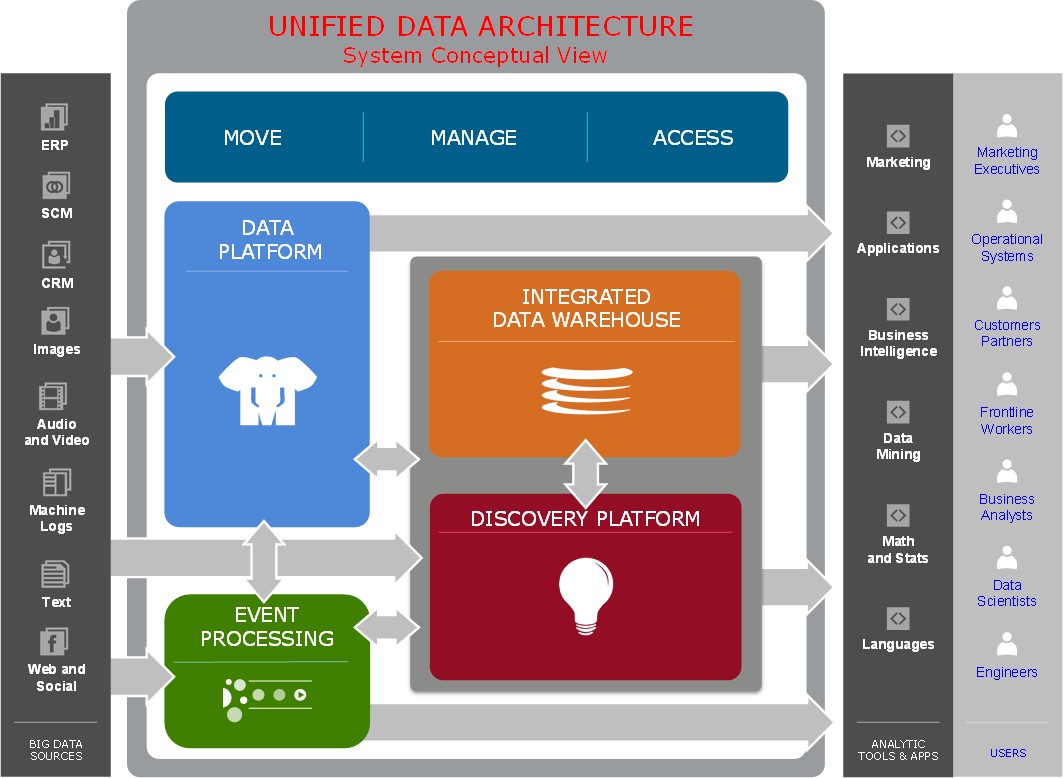
Big Data Architecture/Solutions (by AsterData/Teradata)
Enablers of Big Data Analytics
- In-memory analytics - Storing and processing the complete data set in RAM
- In-database analytics - Placing analytic procedures close to where data is stored
- Grid computing & MPP - Use of many machines and processors in parallel (MPP - massively parallel processing)
- Appliances - Combining hardware, software, and storage in a single unit for performance and scalability
Big Data Technologies
- MapReduce, Hadoop, NoSQL, Hive, Pig, Hbase,Mahout, Sqoop, Hcatalog, etc.
- Google's MapReduce distributes the processing of very large multi-structured data files across a large cluster of ordinary machines/processors
- Video: What is Hadoop?
- NoSQL (Not Only SQL): new style of non-relational, distributed, open-source and horizontally scalable database serving up discrete data stored among large volumes of multistructured data to end-user and automated Big Data applications, triggered by the needs of Web 2.0 companies such as Facebook, Google, and Amazon.com (see A List of NoSQL databases)
- Big Data Vendors: open-source APACHE SOFTWARE FOUNDATION (e.g., Hadoop), MapR (mapr.com), Hortonworks (hortonworks.com), IBM (Netezza, InfoSphere), Oracle (Exadata, Exalogic), Microsoft, Amazon, Google, etc.
MapReduce
- For applications standard SQL employed by relational DBMSs having difficulty with: indexing and search, machine learning, graph analysis, text analysis, etc.
- Parallel computing is handled transparently by the system without developers' involvement
- "MapReduce is a programming model (not a programming language) and an associated implementation for processing and generating large data sets. Programs written in this functional style are automatically parallelized and executed on a large cluster of commodity machines. This allows programmers without any experience with parallel and distributed systems to easily utilize the resources of a large distributed system." (Dean & Ghemawat, 2004)
- See a graphical depiction of the MapReduce process and a machine learning library of "algorithms for clustering, classification and batch-based collaborative filtering" implemented using MapReduce: Apache Mahout
Hadoop
- Hadoop, created by Doug Cutting at Yahoo!, is an open source framework for storing and analyzing massive amounts of distributed, unstructured data
- Access unstructured and semi-structured data (e.g., log files, social media feeds, other data sources)
- Break the data up into parts which are then loaded into a file system made up of multiple nodes (machines) running on commodity hardware using HDFS (see Apache Hadoop)
- Each part is replicated multiple times and loaded into the file system for replication and failsafe processing
- Jobs are distributed to the clients, and once completed the results are collected and aggregated using MapReduce
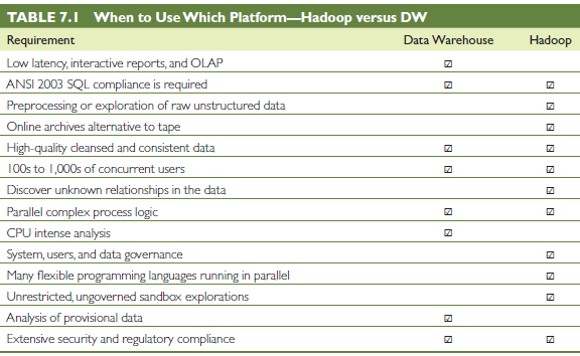
Hadoop versus Data Warehouse
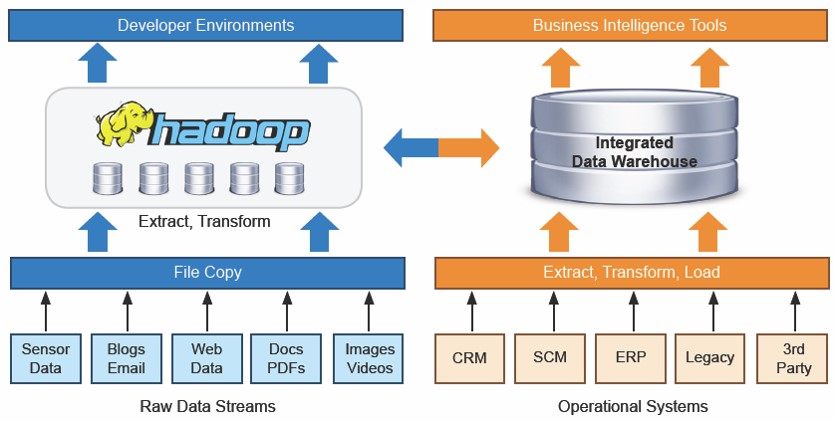
Coexistence of Hadoop and DW
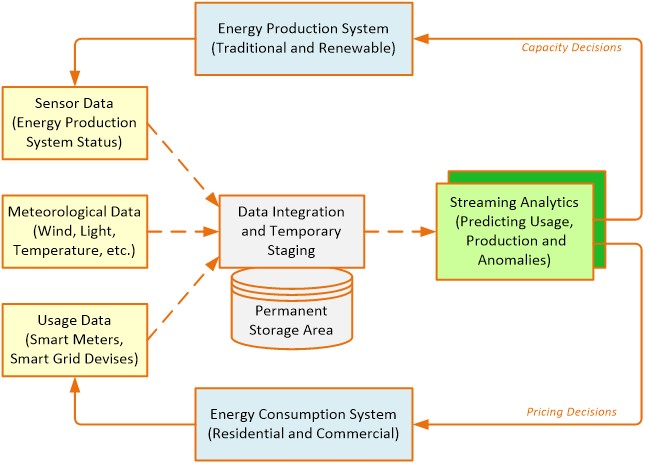
Stream Analytics in Energy Industry
3. Predictive Analytics
- What is predictive analytics?
- Data Mining
- Predictive Modeling
- Text Analytics and Text Mining
Basic Components
- The Data: A predictive model is only as good as the historical data that underlies it. "Google doesn't have better models; it just has more data."
- The Statistics: the set of mathematical techniques, ranging from basic to advanced that are applied to the data to derive inference, meaning, and insight. The most common statistical technique used in predictive analytics is linear regression, the iterative process of selecting and testing the impact of variables on the outcome.
- The Assumptions: the most common being that the future will continue to be like the past.
Source: "A Predictive Analytics Primer" by Thomas H. Davenport in HBR
Data Mining?
- The nontrivial process of identifying valid, novel, potentially useful, and ultimately understandable patterns in data stored in structured databases. -- Fayyad et al., (1996)
- Keywords in this definition: Process, nontrivial, valid, novel, potentially useful, understandable.
- Knowledge mining
- Knowledge discovery
- Knowledge extraction
- Pattern analysis/searching
- Information harvesting, Data dredging, ...
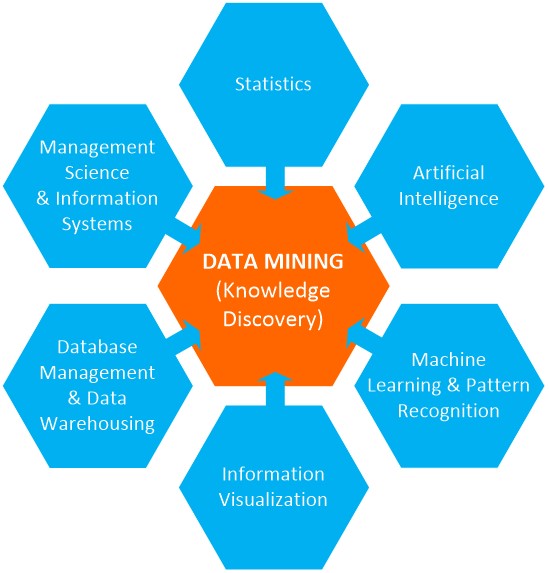
Data Mining Is Blend of Multiple Disciplines
How Data Mining Works?
Extract patterns (mathematical relationships, numeric and/or symbolic, among data items) from data
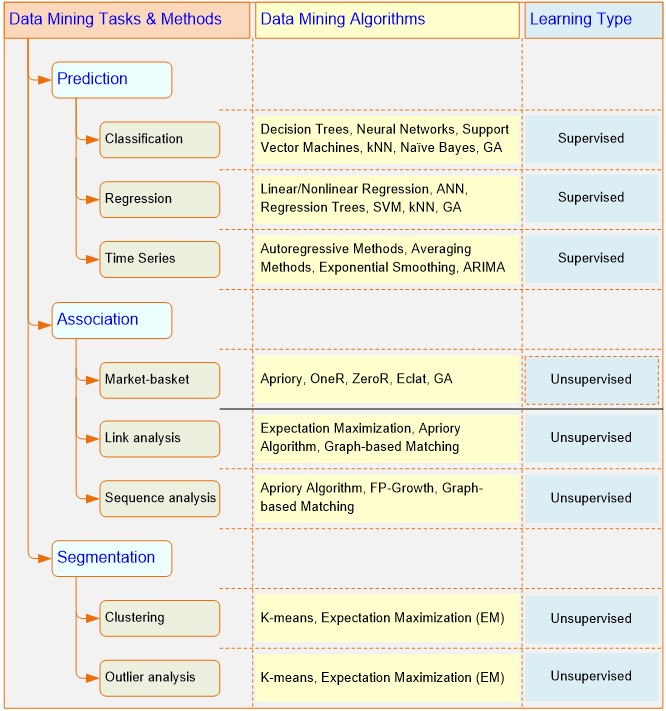
- Association or association rule learning in data mining: find the commonly co-occurring groupings of things, e.g., beer and diapers together in market-basket analysis of the retail industry. Two commonly used derivatives of association rule mining are link analysis (e.g., the link between web pages) and sequence mining (relationships are examined in terms of their order of occurrence to identify associations over time).
- Prediction: In reality prediction is experience and opinion based while forecasting is data and model based - Guessing > Predicting > Forecasting, but prediction and forecasting are synonymous in data mining. Prediction is either classification (predict class label) or regression (predict a number).
How Data Mining Work?
- Cluster (segmentation): Create groups so that the members within each group have maximum similarity and the members across groups have minimum similarity. Unlike in classification, the class labels are unknown in clustering. After reasonable clusters have been identified, they can be used to classify and interpret new data. One example from marketing is market segmentation.
- Sequential (or time series) relationships: discover time-ordered events (e.g., predict that an existing banking customer who already has a checking account will open a savings account followed by an investment account within a year). Time-series forecasting in statistics (the data consists of values of the same variable that is captured and stored over time in regular intervals) can be included in this category.
- Visualization and visual analytics
A Taxonomy for Data Mining
Predictive Modeling
- Most commonly practiced branch in data mining and applied to complex prediction problems (estimate future by learning from the past) where other techniques are not capable of producing satisfactory results: Regression, Neural Networks, Support Vector Machines, ...
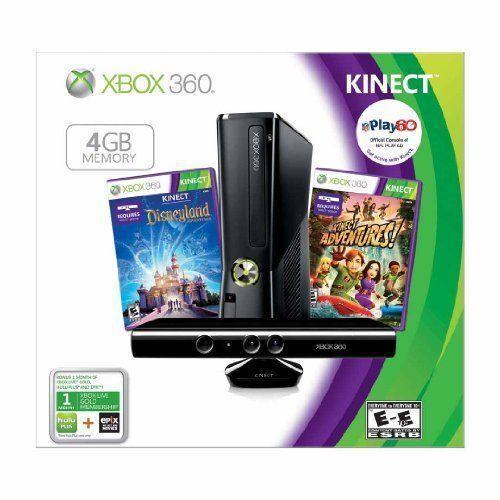
- Typically include a machine learning algorithm that learns certain properties from a training dataset in order to make those predictions (e.g., Xbox Kinect, self-driving car)
- Machine learning, an AI buzzword that describes a form of ultra-fast, complex computer data analysis and statistical modeling (Amazon Echo, Apple Siri, Google Home, Microsoft's Cortana and Kinect)
- Traditional statistics starts with formulating a cause-effect hypothesis such as advertising is a driver of sales and then tests the hypothesis. Machine learning starts with the outcome (i.e. how much were sales) and trains a computer to automatically uncover the factors that are driving this particular outcome.
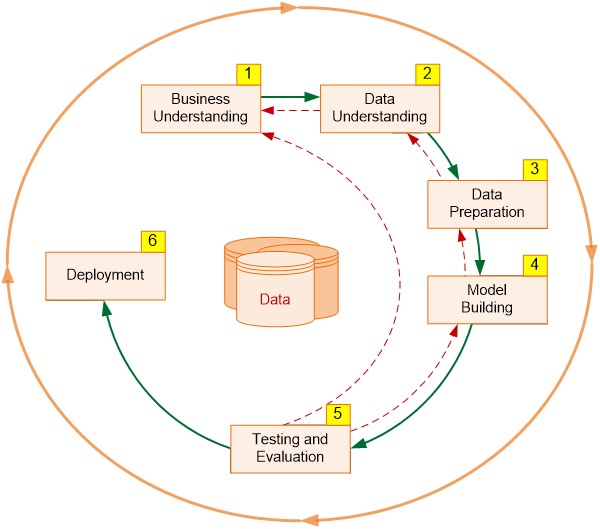
Cross Industry Standard Process
Proposed in 1990s by a European consortium
Some Applications of Data Mining
- Automate the loan application process
- Detecting fraudulent transactions
- Maximize return on marketing campaigns
- Improve customer retention (churn analysis)
- Maximize customer value (cross-, up-selling)
- Identify and treat most valued customers
- Optimizing cash reserves with forecasting
- Forecast the direction of stock fluctuations
- Identify and prevent fraudulent activities in trading
More Applications of Data Mining
- Optimize inventory levels at different locations
- Improve the store layout and sales promotions
- Minimize losses due to limited shelf life
- Predict/prevent machinery failures
- Forecast lost department store sales after a natural disaster for insurance claims
- Forecast Insurance claim costs for better business planning
- Determine optimal insurance rate plans
- Optimize marketing to specific customers
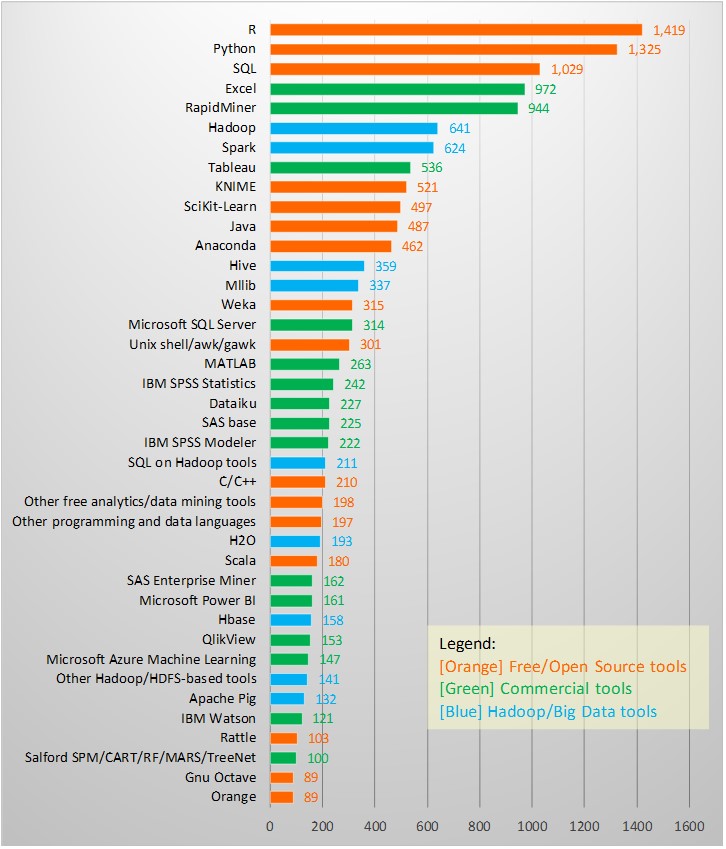
Data Mining Software Tools
Example: Segmentation Using Clustering
Who is the best target for a cross-sell/up-sell campaign (an example from SAS Enterprise Miner)?A consumer bank wants to segment its customers based on historic usage patterns to identify those who might benefit from new product offerings. Some customers might prefer an offer of a low-interest loan whereas others might prefer more convenience in online banking opportunities.
In order to identify customer usage patterns, the bank decides to segment its customers based on historic data about products that they hold. Segmentation was to be used for improving contact strategies in the Marketing Department.
Example: Segmentation Using Clustering
A sample of 100,000 active consumer customers was selected. An active consumer customer was defined as an individual or household with at least one checking account and at least one transaction on the account during a three-month study period.All transactions during the three-month study period were recorded and classified into one of four activity categories: 1. traditional banking methods (TBM), 2. automatic teller machine (ATM), 3. point of sale (POS), 4. customer service (CSC).
Example: Segmentation Using Clustering
A three-month activity profile for each customer was developed by combining historic activity averages with observed activity during the study period. Historically, for one CSC transaction, an average customer would conduct two POS transactions, three ATM transactions, and ten TBM transactions.
Each customer was assigned this initial profile at the beginning of the study period. The initial profile was updated by adding the total number of transactions in each activity category over the entire three-month study period.
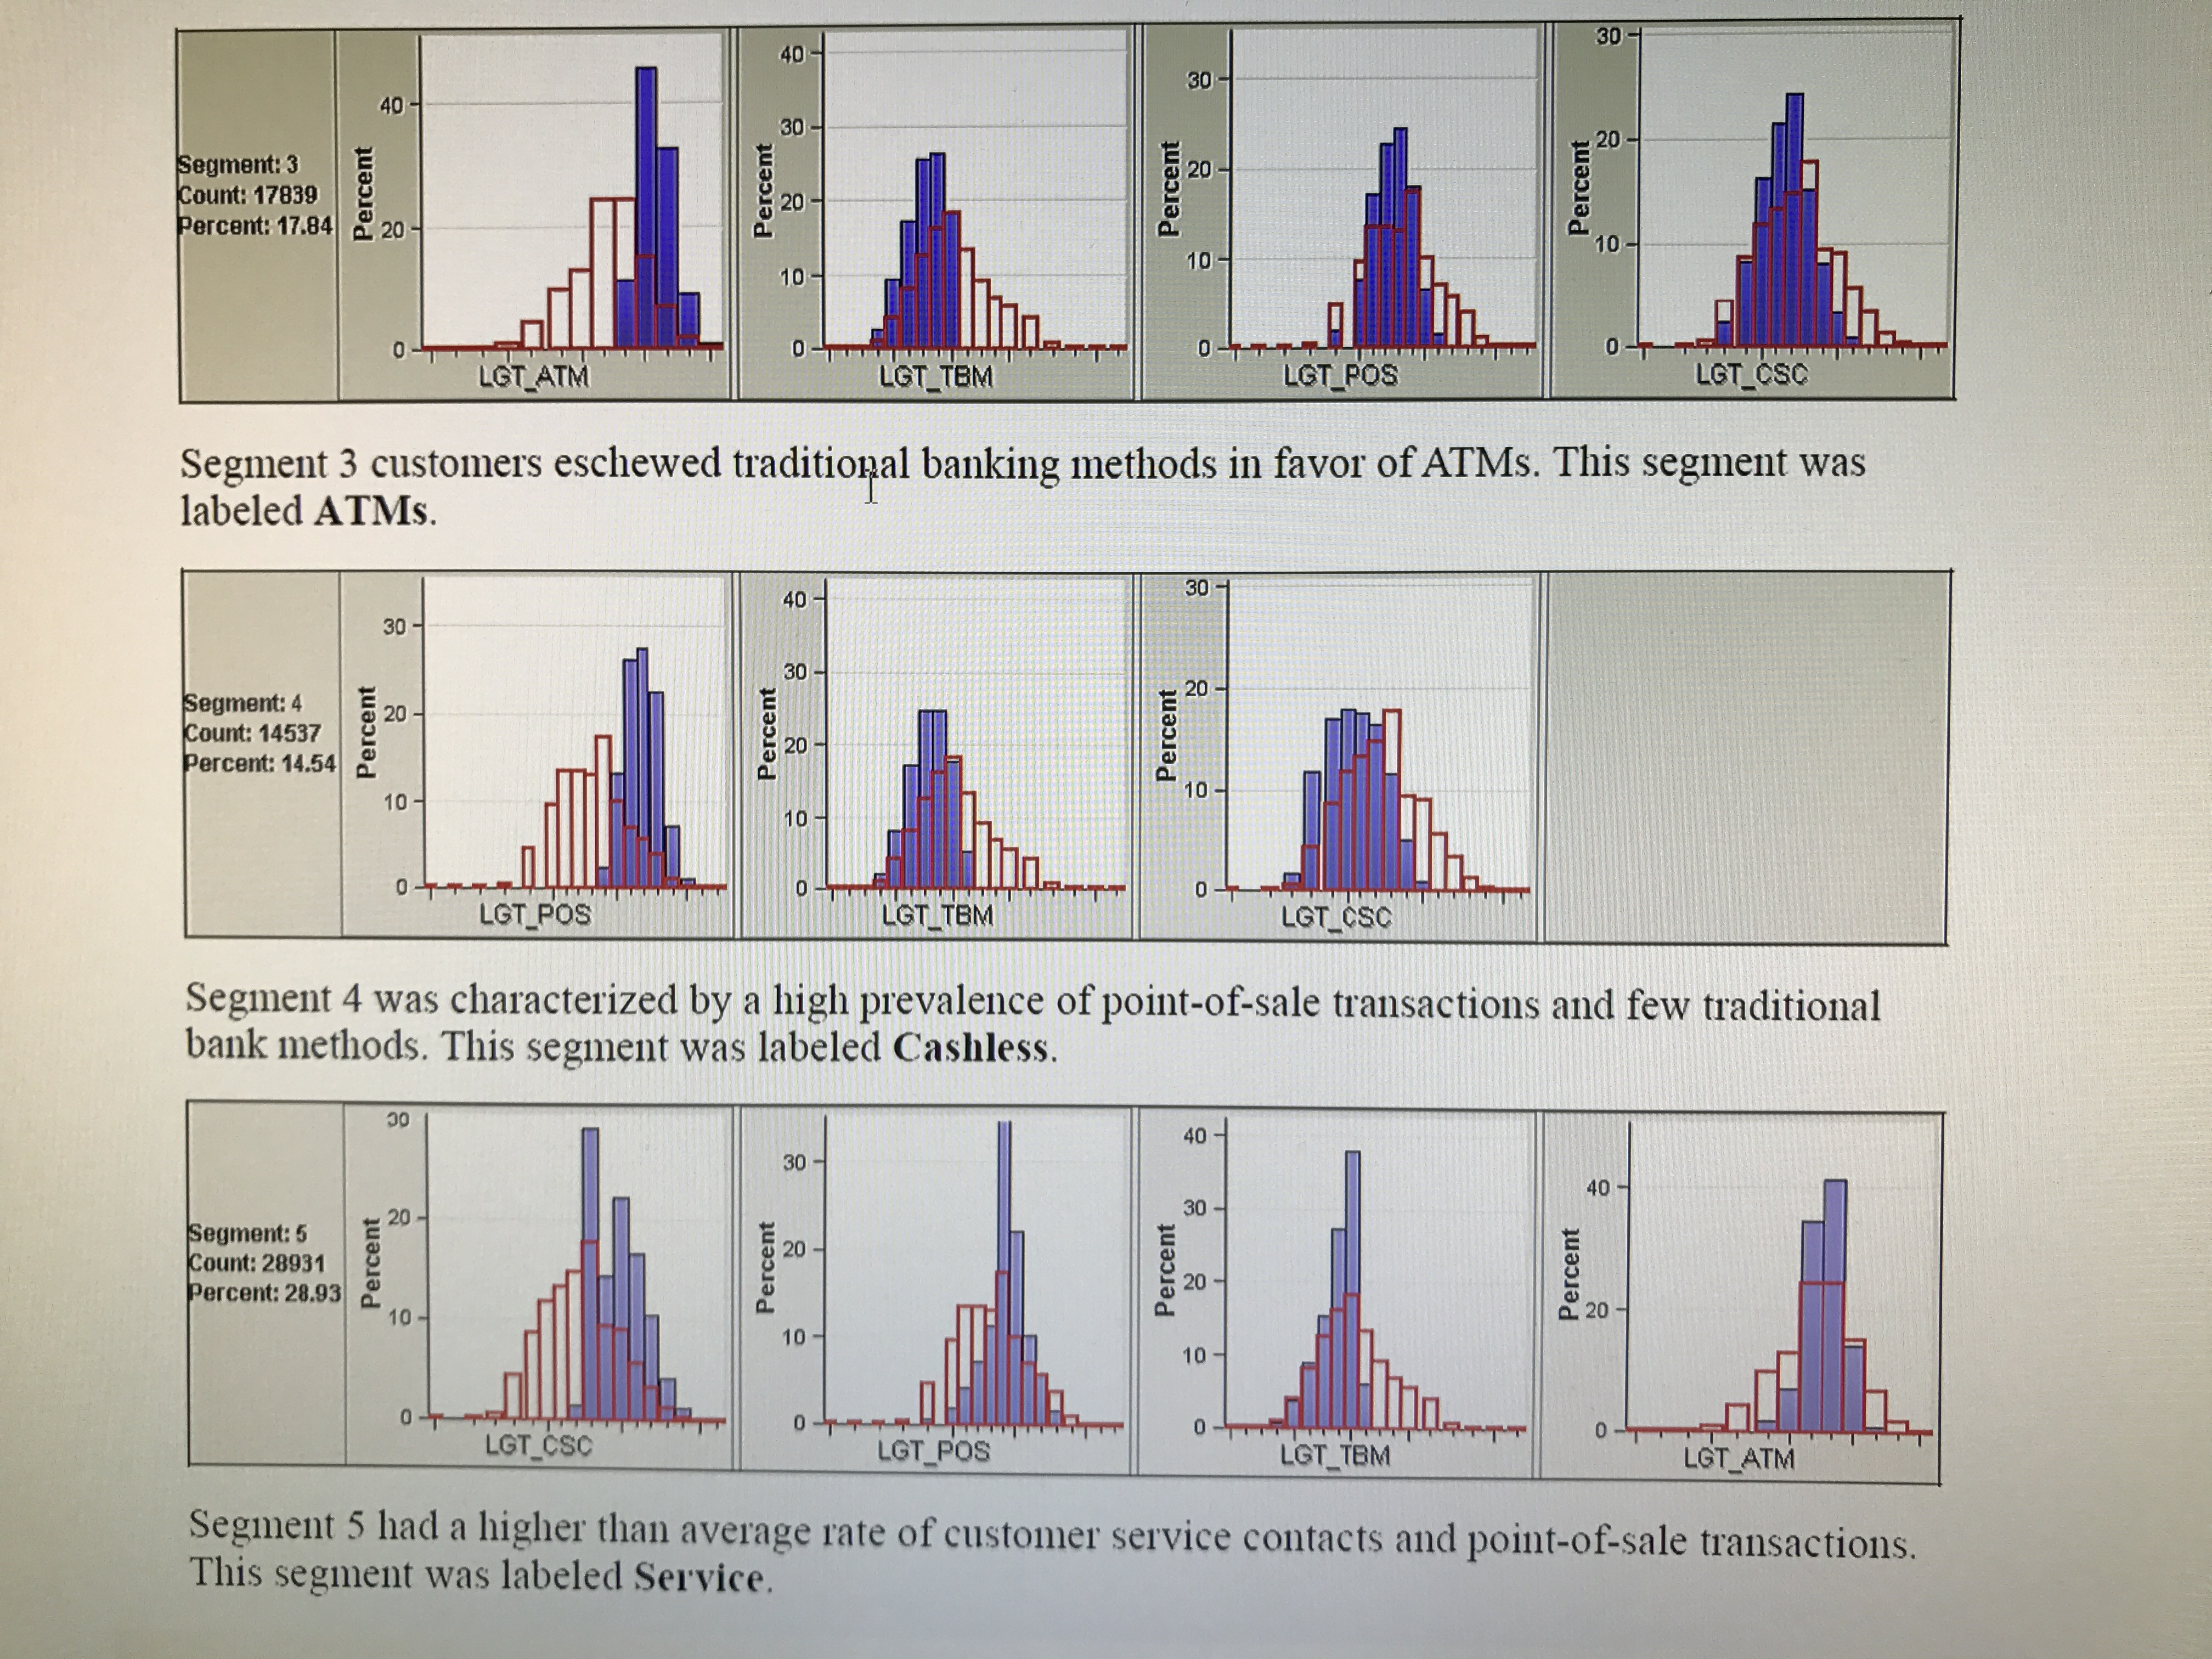
Segments After Applying Clustering
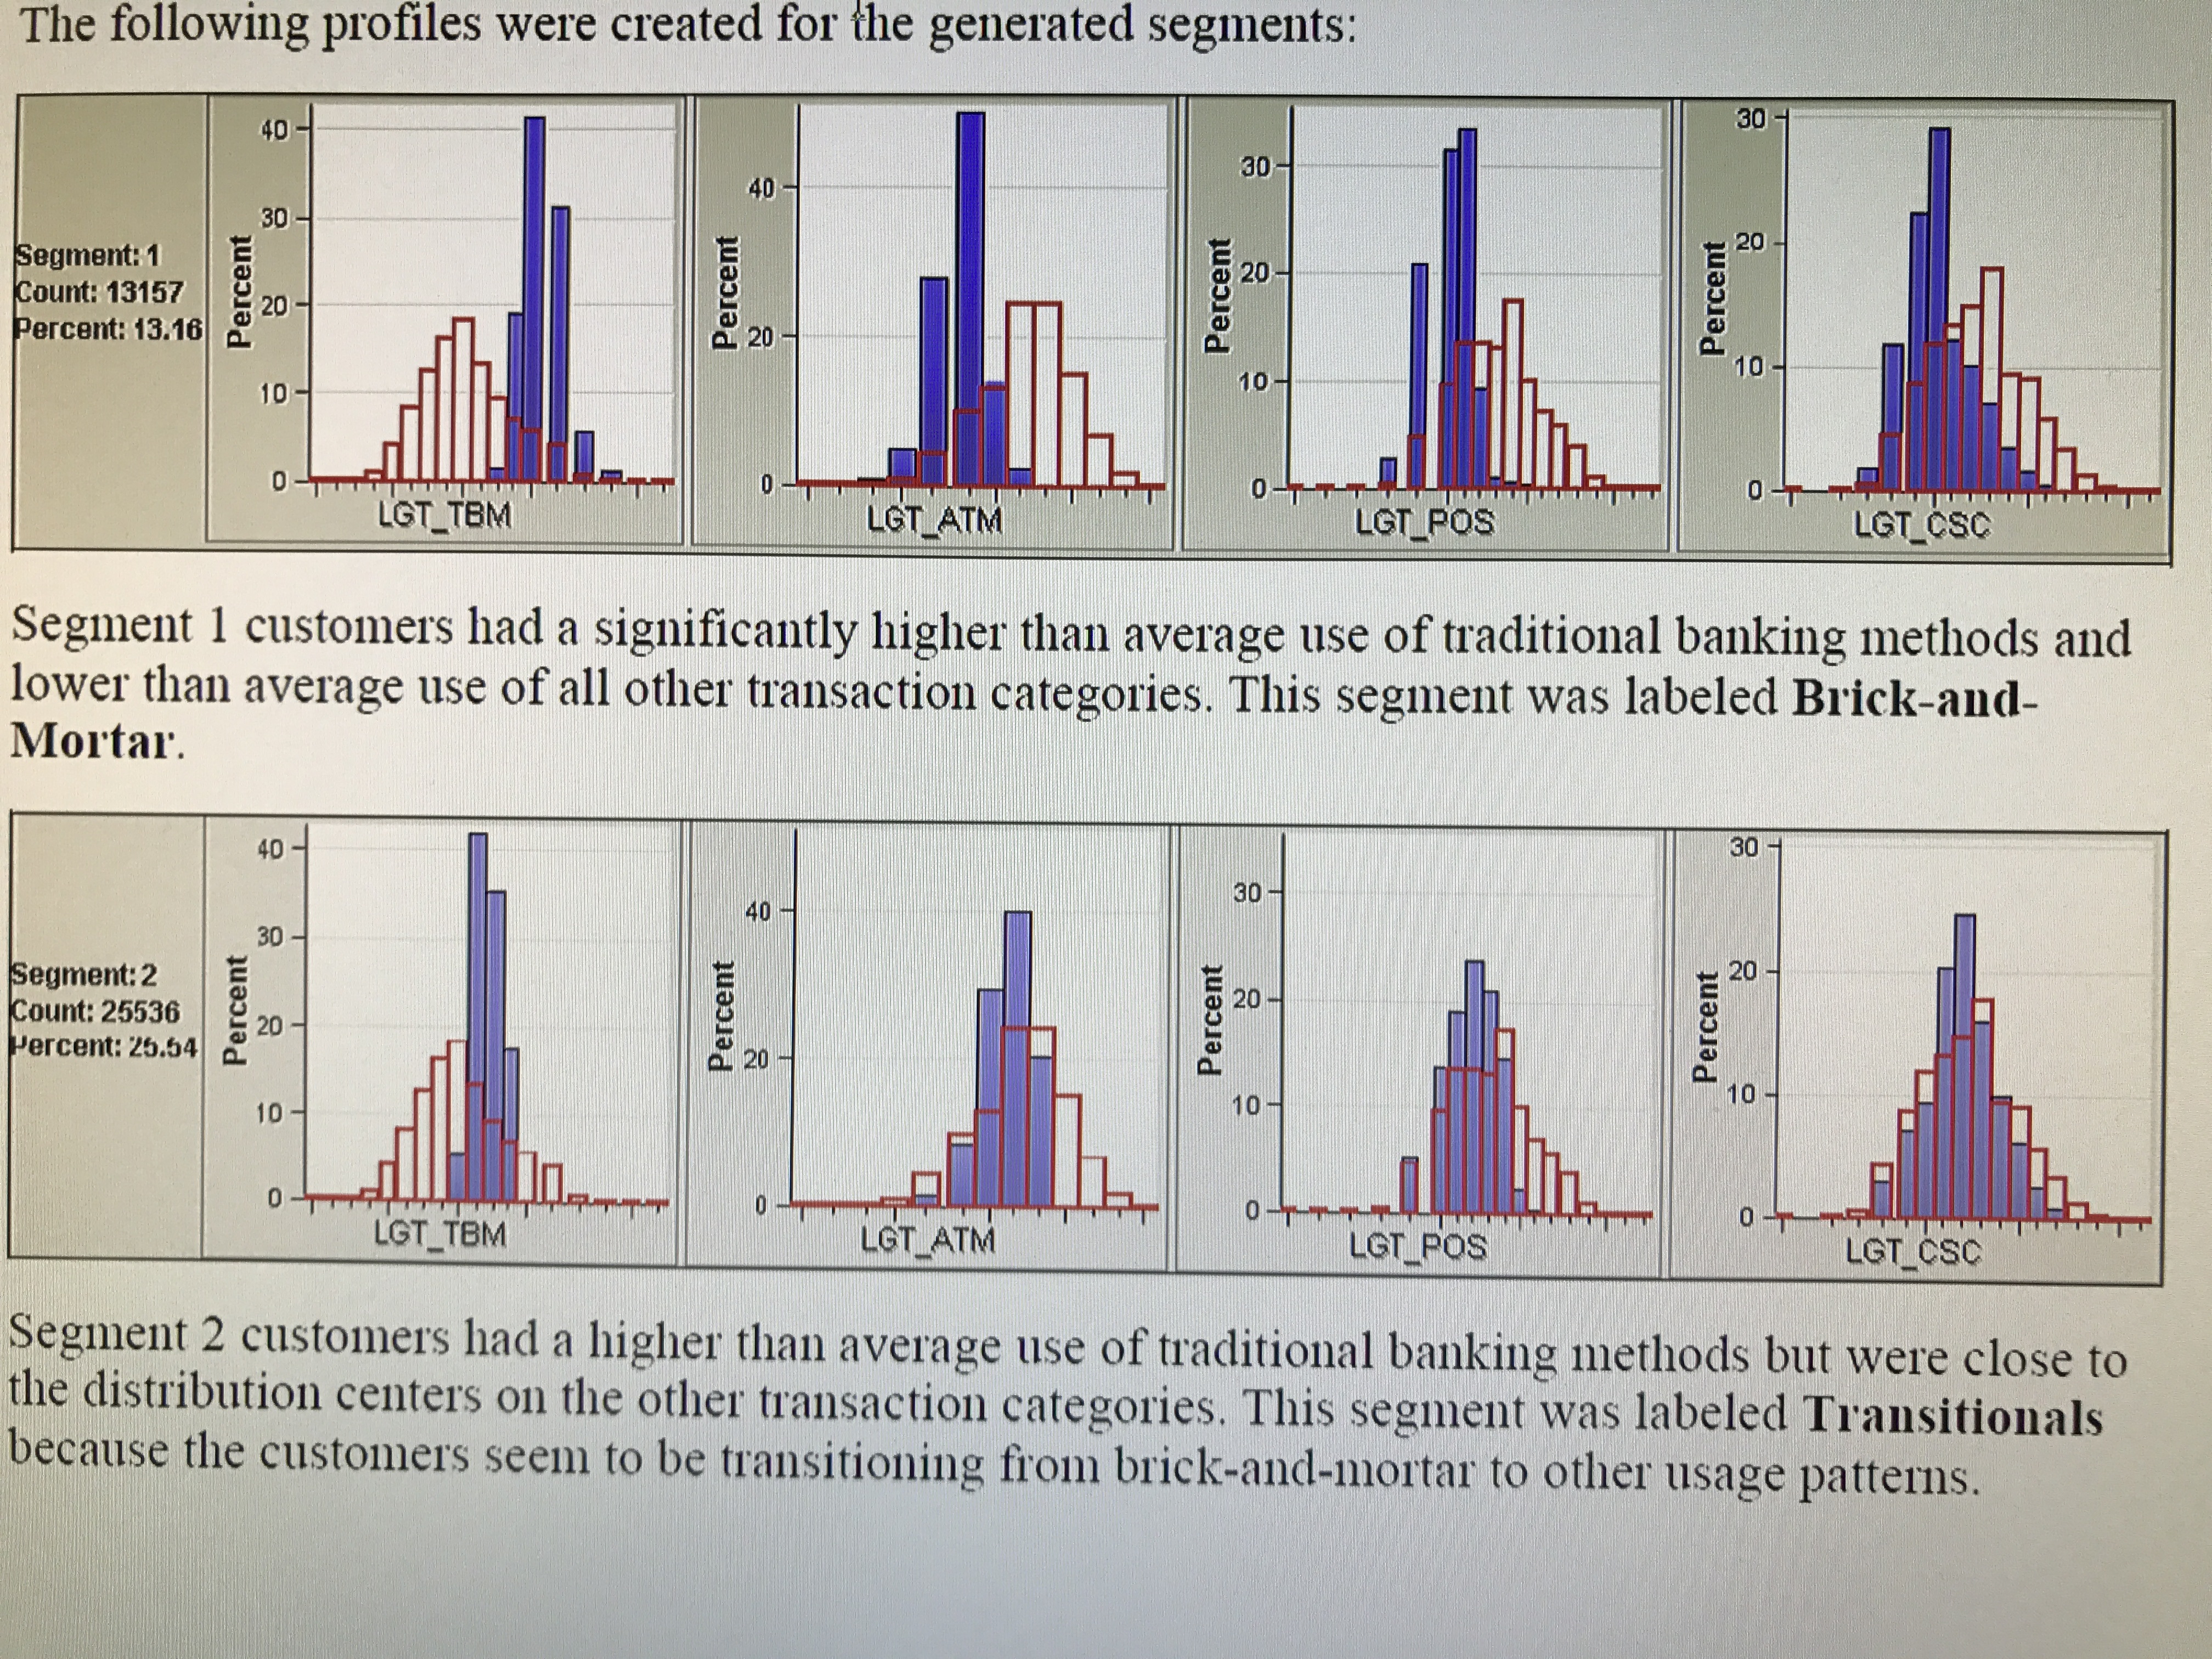
Segments After Applying Clustering
An Example from Machine Learning
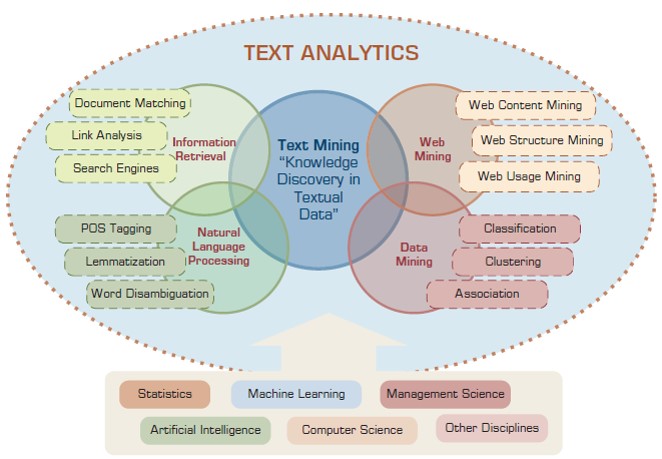
Text Analytics and Text Mining
- 85% percent of all corporate data is captured and stored in some kind of unstructured form such as text and doubling in size every 18 months (Merrill Lynch and Gartner)
- Have to analyze these text information
- Text Analytics and Text Mining
- Text Mining: a semi-automated process of extracting knowledge from unstructured data sources (knowledge discovery in textual databases)
- Text Analytics = Information Retrieval + Information Extraction + Data Mining + Web Mining
- Text Analytics = Information Retrieval + Text Mining
Applications Areas and Disciplines
Data Mining vs Text Mining
- Semi-automated processes
- Discovering novel and usefule patterns
- Data mining is applied to structured data, e.g., in databases.
- Text mining is applied to unstructured data such as Word documents, PDF files, text excerpts, HTML/XML files, etc.
- In text mining, need to impose structure to the data and then mine the structured data.
Text Mining Applications
- Security - ECHELON surveillance system, EUROPOL's OASIS (Overall Analysis System for Intelligence Support) to track transnational organized crime, deception detection
- E-mail spam filtering, automatic response generation, prioritization and categorization
- Finance (quarterly reports)
- Medicine (discharge summaries)
- Marketing (better CRM by mining customer comments)
- Law (mining legal texts) - e.g., 92% of the supreme court cases are appeals of a non-constitutional nature
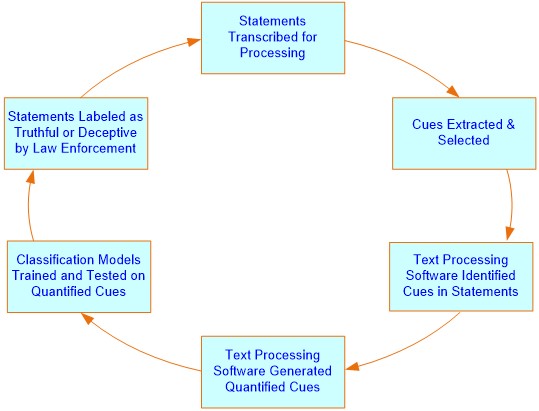
Text Mining Example - Deception Detection
- Difficult
- More difficult if limited to only text
- A study analyzed text-based testimonies of person of interests at military bases and used only text-based features (cues)
- Example cues: verb count, noun-phrase count, average number of clauses and sentence length to indicate complexity, modifiers and modal verbs to indicate uncertainty, passive voice and objectification to indicate nonimmediacy, typographical error ratio to indicate informality, ...
- 371 usable statements are generated and 31 features are used
- Results (overall % accuracy): Logistic regression 67.28, Decision trees 71.60, Neural networks 73.46
Text-Based Deception-Detection Process
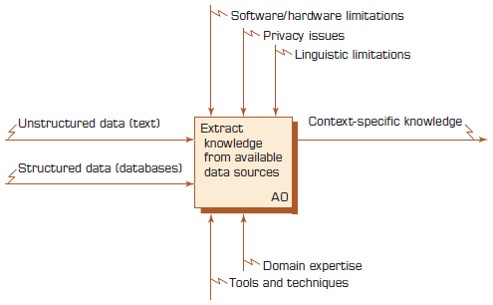
Context Diagram for Text Mining Process
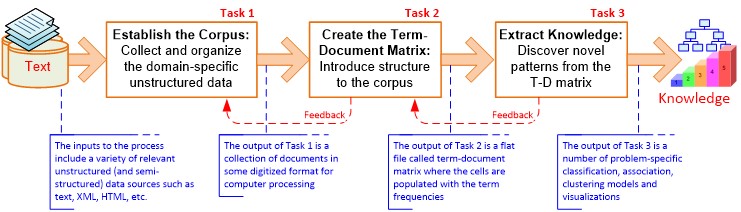
Three-Step/Task Text Mining Process
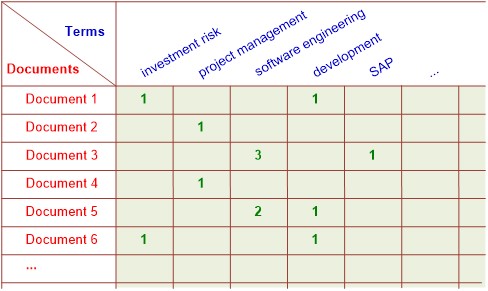
Term-by-Document Matrix Example
Sentiment Analysis
- Sentiment: belief, view, opinion, and conviction
- Answer "What do people feel about a certain topic?"Analyzing data related to opinions of many using a variety of automated tools
- One important application of Sentiment Analysis is CRM: customers/consumers' opinions
- Other applications: voice of employee, voice of the market, brand management, financial Markets, politics, government intelligence, etc.
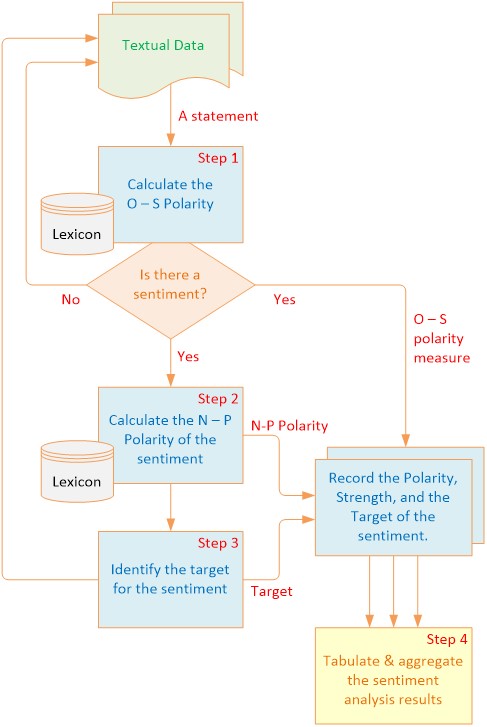
Sentiment Analysis Process
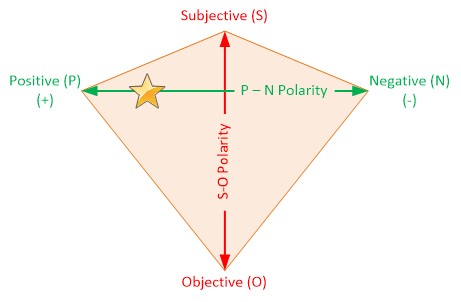
P-N Polarity and S-O Polarity
Methods for Polarity Identification
- Using a Lexicon - WordNet (wordnet.princeton.edu) is a general-purpose lexicon database of English. Nouns, verbs, adjectives and adverbs are grouped into sets of cognitive synonyms (synsets), each expressing a distinct concept. An extension of WordNet includes polarity (Positive-Negative; P-N) and objectivity (Subjective-Objective, S-O) labels for each term in the lexicon.
- Using a Collection of Training Documents - perform sentiment classification using statistical analysis and machine learning tools based on the vast resources of labeled (manually by annotators or using a star/point system) documents such as RottenTomatoes, Internet Movie Database, Amazone, C-NET, eBay.
4. Digital Analytics
- Web Mining
- Search Engines
- Web Analytics
- Social Network Analysis
- Social Media Analytics
Digital Analytics
- Digital Analytics models data collected in interactive channels such as web, social media, and mobile to help make strategic business decisions and maintain a competitive edge.
- Need methods from descriptive and predictive analytics including data mining and text mining described before and other methods
- Web contains a lot of data in HTML, XML, text format
- Web mining is the process of discovering intrinsic relationships from textual/linkage/usage data on the web
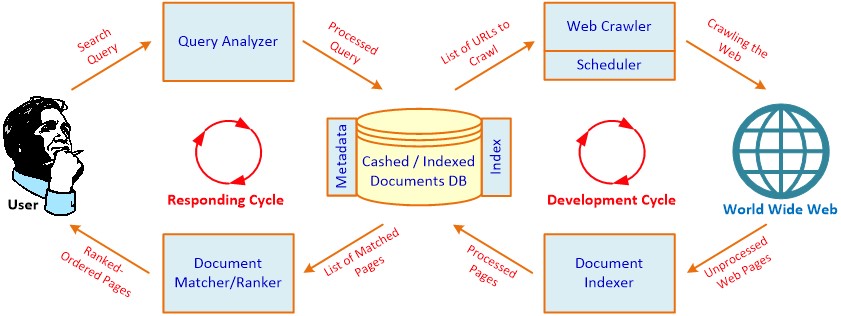
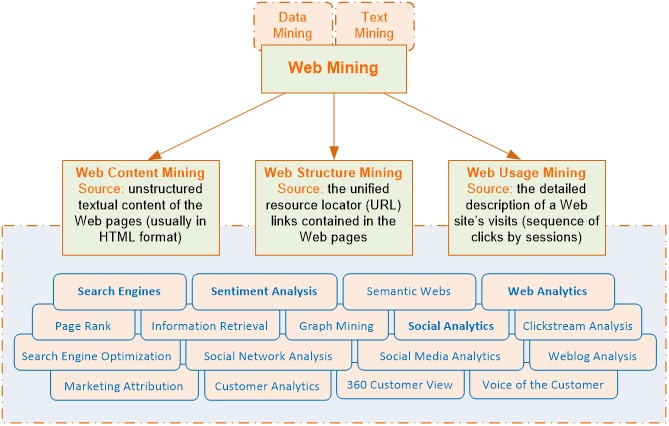
Web Mining
Web Content and Structure Mining- Mining Web's textual content data collected using Web crawlers
- Components of web pages: hyperlinks, authoritative pages, hubs (a collection of links to authoritative pages)
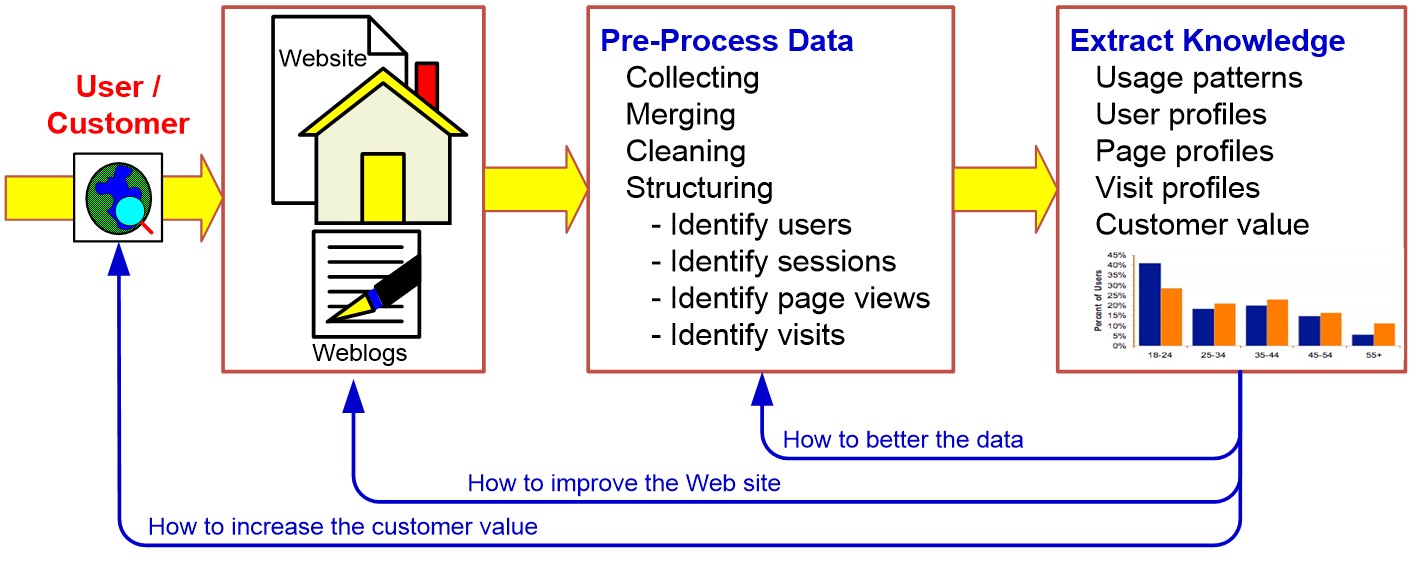
- Extract information from data generated through Web page visits and transactions (server access logs, referrer logs, agent logs, and client-side cookies, user characteristics, usage profiles, metadata such as page attributes, content attributes, and usage data)
- Clickstream data analysis
- Understand user behavior!
Clickstream Data Analysis
Web Usage Mining Applications
- Determine the lifetime value of clients
- Design cross-marketing strategies across products
- Evaluate promotional campaigns
- Target electronic ads and coupons at user groups based on user access patterns
- Predict user behavior based on previously learned rules and users' profiles
- Present dynamic information to users based on their interests and profiles, etc.
Search Engine
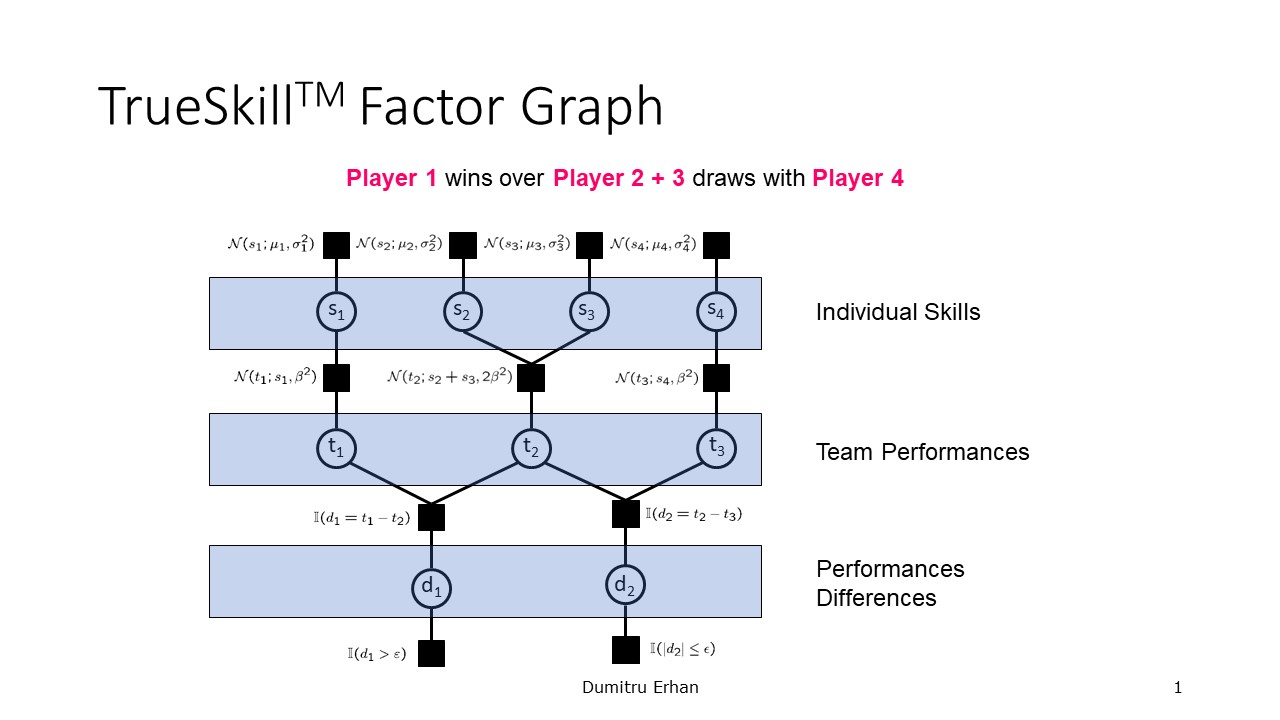
Ranking for Xbox & Bing
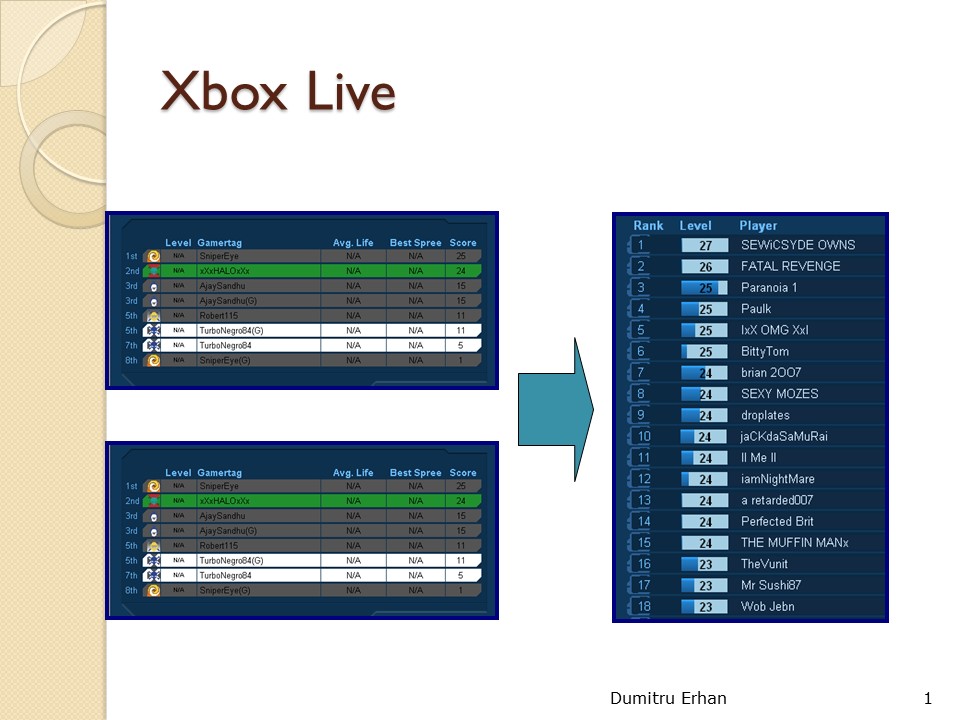
Ranking for Xbox & Bing
Search Engine Optimization
- Intentionally increase the visibility of an e-commerce site or a Web site in a search engine's natural (unpaid or organic) search results
- Internet marketing strategy
- Content, HTML, keywords, external links, Indexing (Webmaster submission of URL, proactively and continuously crawling the Web)
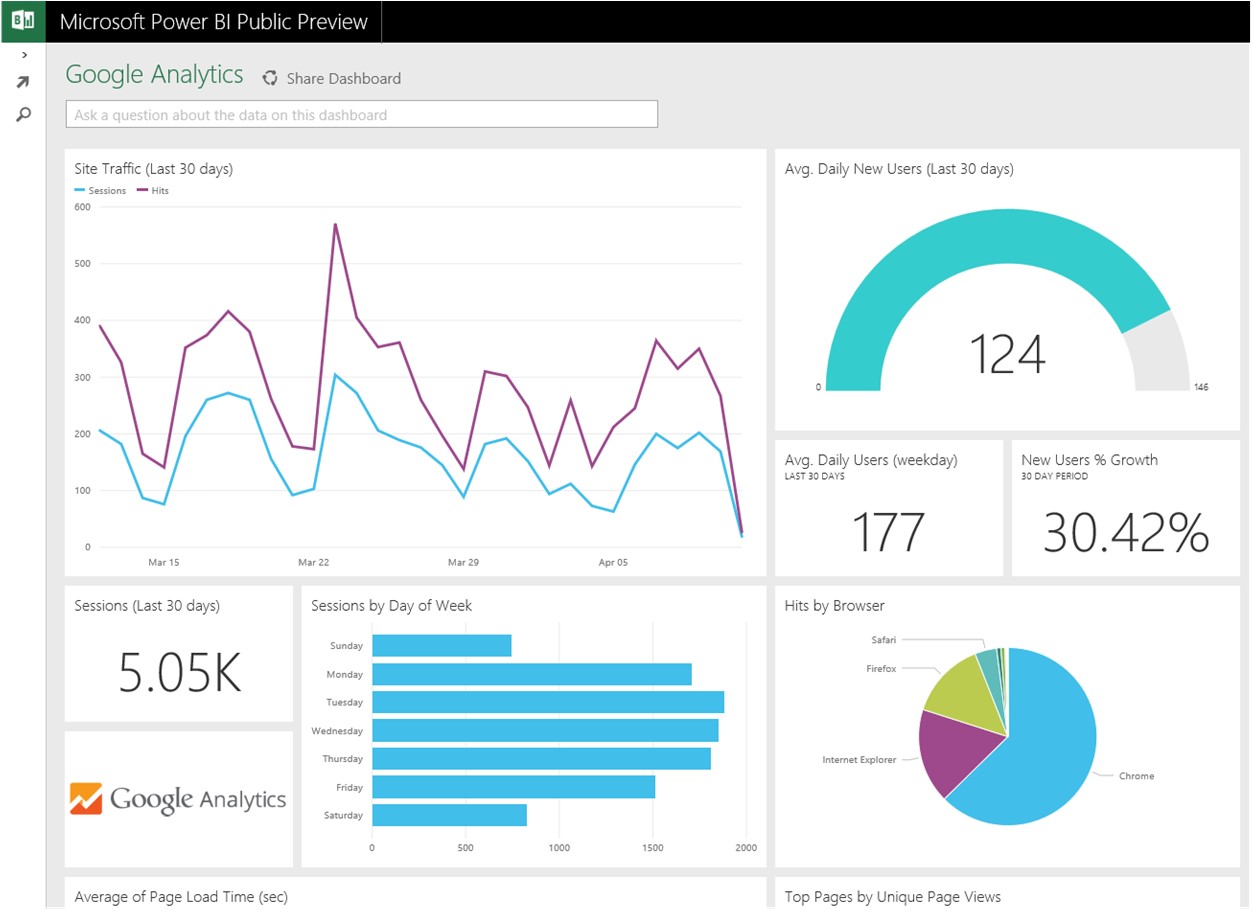
Web Analytics Metrics
- Website usability (page views, time on site, downloads, click paths)
- Traffic sources (referral websites, search engines, direct, offline/online campaigns)
- Visitor profiles (keywords, content groupings, geography, time of day, landing page profiles)
- Conversion statistics (new visitors, returning visitor, leads, sales/conversions, abandonment/exit rate)
A Web Analytics Dashboard
Web Mining
An Example from My Own Research
Study customer behavior using Taobao's P4P Data- Is there a relationship between the number of product advertisements shown in response to a search and the distribution of prices of products advertised?
- Does the coefficient of variation of prices shown in advertisements have a relationship with the number of advertisements when the search data is grouped into two groups based on whether a search keyword(s) is present or not?
- Does the number of advertisements shown depend on whether one initiates the search with a keyword?
- Does the amount of time spent by the customer before clicking any advertisement, if that happens, depend on whether search keyword is present or not? What moderating variables are involved in this relationship? And many other research questions ...
Social Network Analysis
- Interdisciplinary field of Social psychology, Sociology, Statistics, Graph theory
- Study relationships between individuals, groups, organizations, societies
- Communication networks, community networks, criminal networks, innovation networks, ...
- Metrics: connection (multiplexity, network closure, etc.), distribution (bridge, centrality, density, etc.), segmentation (cliques and social circles, clustering coefficient, cohesion)
Social Media Analytics
- Social media: 1. collaborative projects (Wikipedia), 2. blogs and microblogs (Twitter), 3. content communities (YouTube), 4. social networking sites (Facebook), 5. virtual game worlds (World of Warcraft), 6. virtual social worlds (Second Life)
- Study relationships between individuals, groups, organizations, societies
- For business: the systematic and scientific ways to consume the vast amount of content created by Web-based social media outlets, tools, and techniques for the betterment of an organization's competitiveness
- Tools to measure social media impact: Descriptive and Predictive Analytics, Social Network Analysis
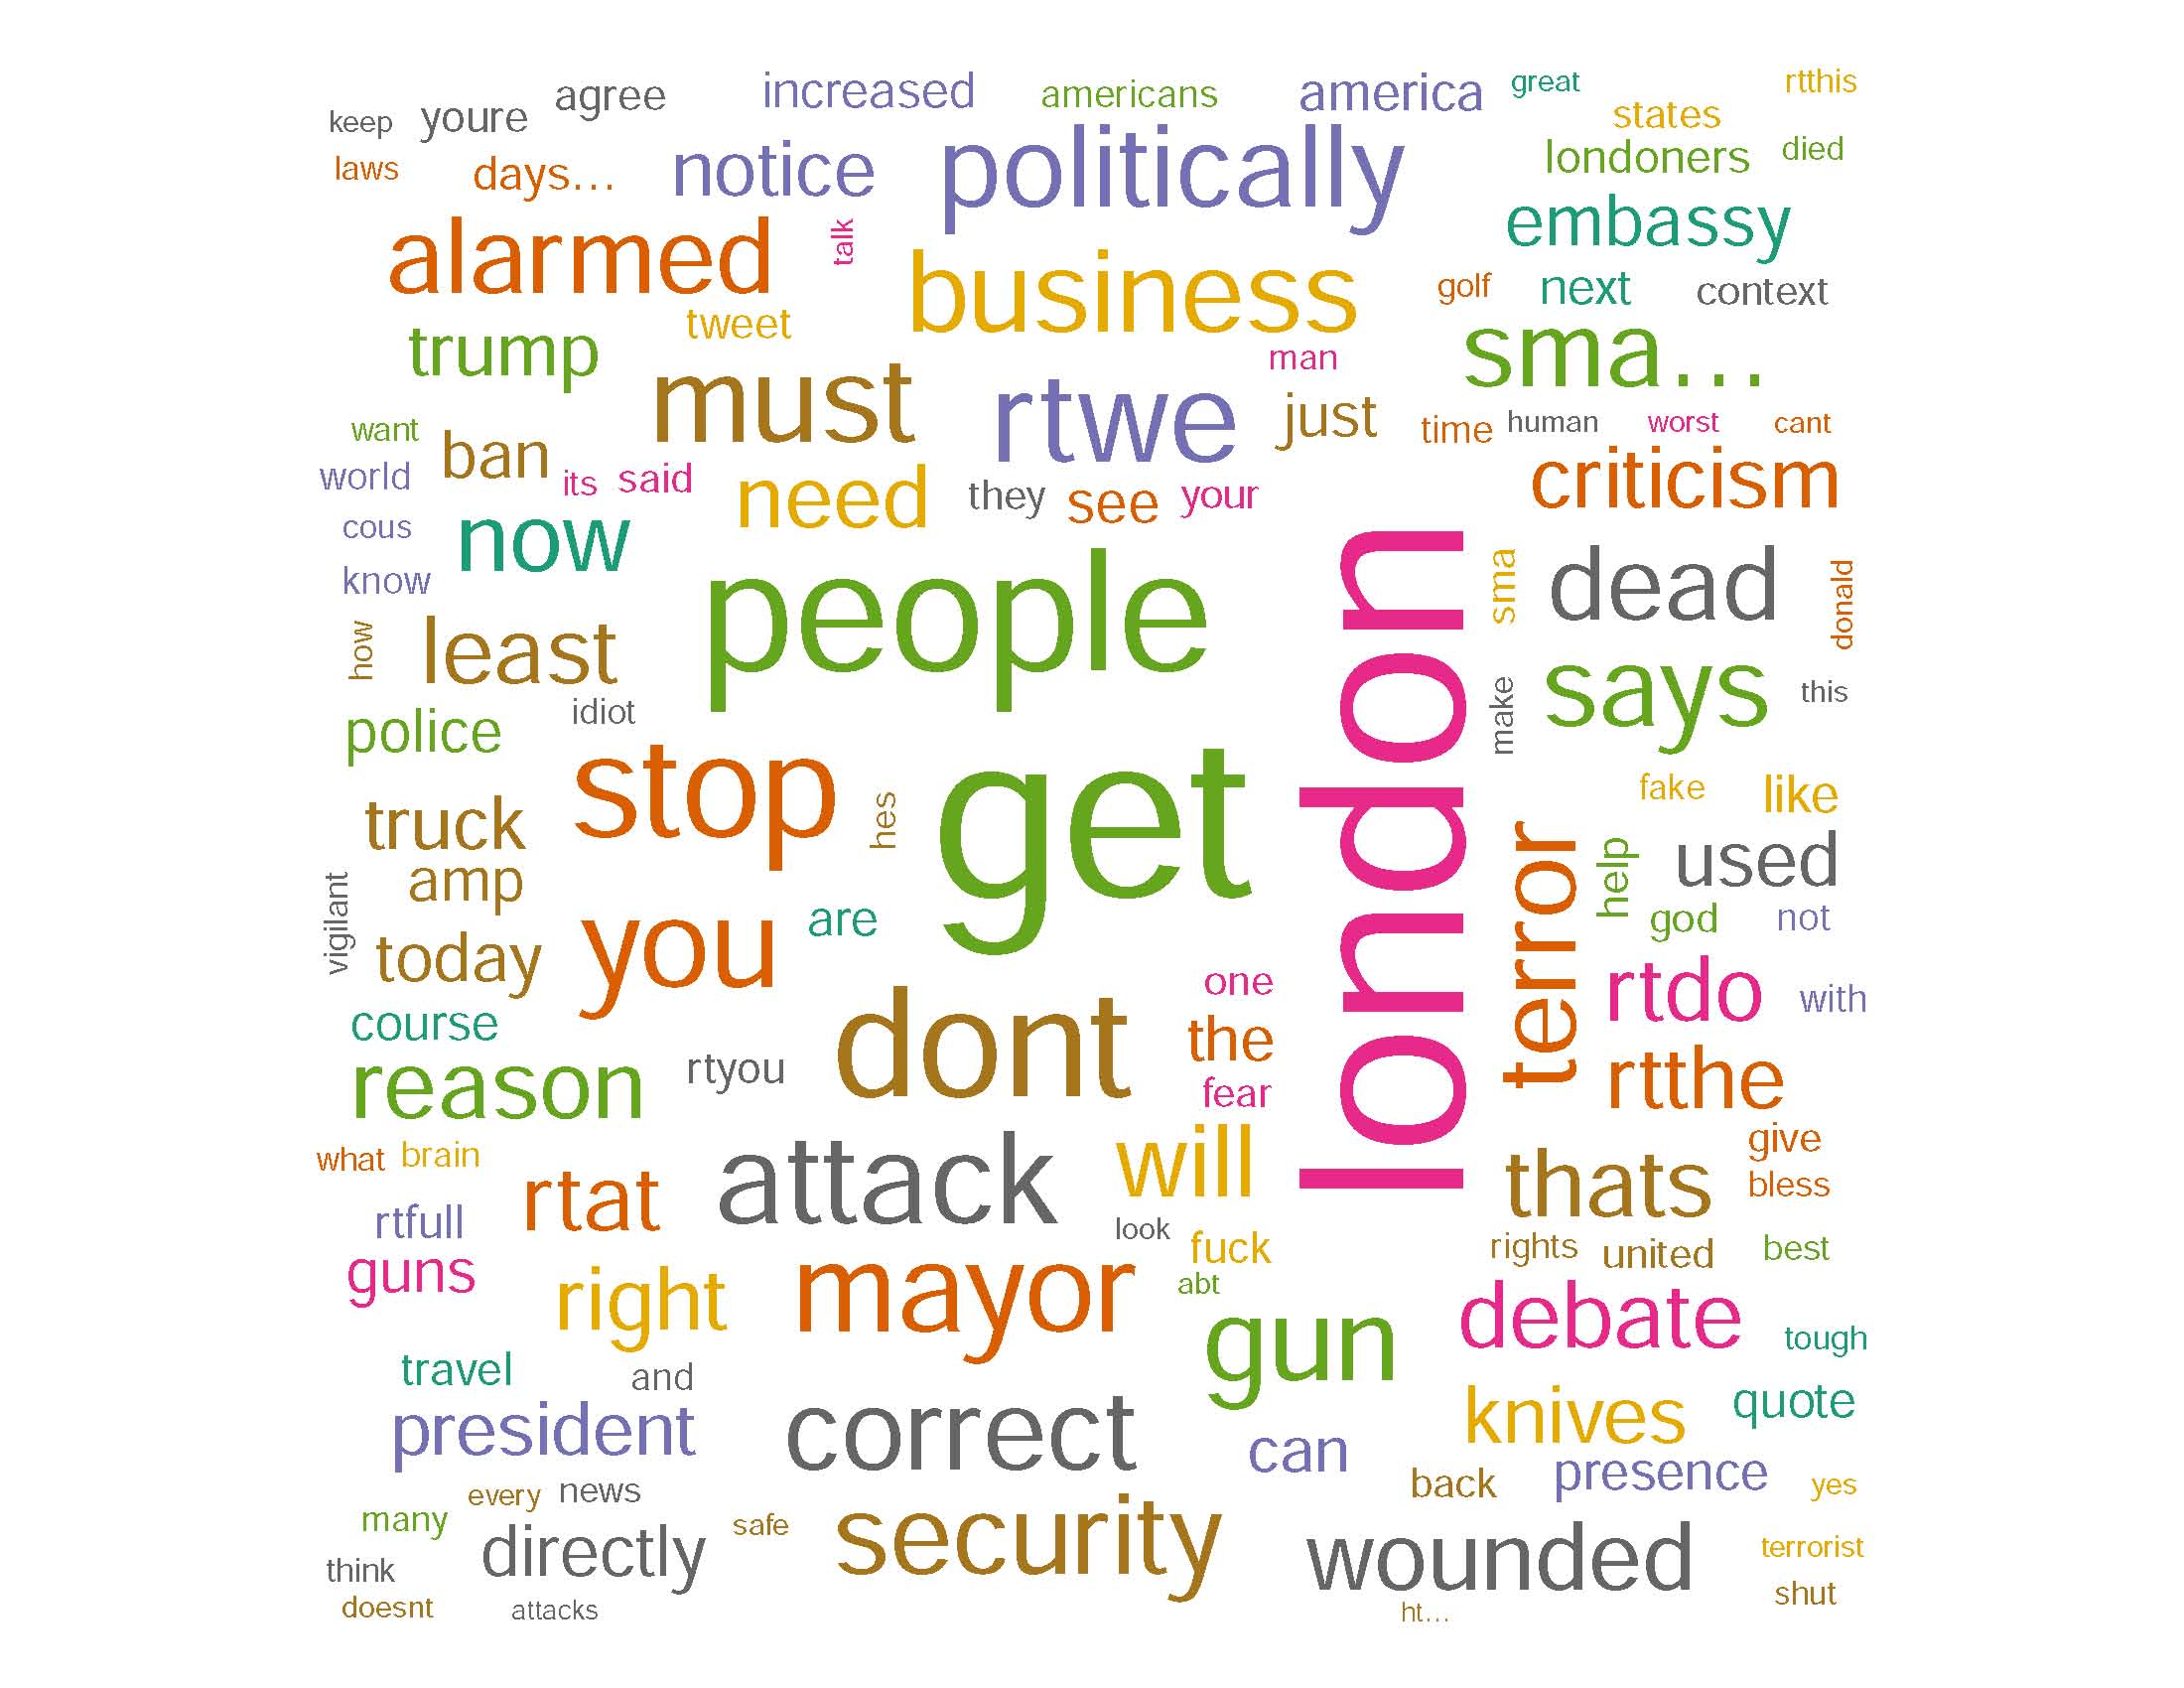
Sentiment Analysis using R and Twitter
PREREQUISITES:- R and RStudio
- R libraries: twitteR, RCurl, RJSONIO, stringr, bitops, httr, tm, wordcloud, ggplot2, plyr, gridExtra, RSentiment
- twitter account
- Consumer Key (API key) & Consumer Secret (API Secret) - https://apps.twitter.com
- Access Token & Token Secret
- R code
Word Cloud - Visual Representation of Text Data
Another Example: Web Scraping
- Data scraping used for extracting data from websites.
- Transform unstructured data on the web, from HTML format into a structured data stored in a local database or spreadsheet
- Fetch web pages (web crawling) for later processing, e.g., contact scraping (find and copy names and phone numbers, or companies and their URLs, to a list)
- See an example at https://www.r-bloggers.com/web-scraping-and-applied-clustering-global-happiness-and-social-progress-index/
5. Prescriptive Analytics
- Prescriptive Analytics follows Descriptive and Predictive Analytics which produce results like choice alternative
- What's the best possible business decision?
- Optimization and Simulation
- An Example: A brand manager for ColCal Products must determine how much time to allocate between radio and television advertising during the next month. Market research has provided estimates of the audience exposure for each minute of advertising in each medium, which it would like to maximize. Costs per minute of advertising are also known, and the manager has a limited budget of $25, 000: Exposure per minute (radio 350, TV 800); Cost per minute (radio $400, TV $2,000). The manager has decided that because television ads have been found to be much more effective than radio ads, at least 70% of the time should be allocated to elevision. (Solution using Excel's Solver)
Optimize Sales Planning at NBC
- NBC wants to maximize the revenues for the available fixed amount of advertising slots every May for the following television broadcast year starting in the third week of September. Typical client request: dollar amount, demographic interested, program mix, weekly weighting, unit-length distribution, negotiated cost per 1,000 viewers
- Solution: NBC developed a linear programming model to sell the available advertising slots in a optimal manner by minimizing the amount of premium ad slots assigned to a plan and the total penalty incurred in meeting management's goals while meeting constraints on available ad slots, airtime availability, product conflicts, client requirements, budget, show-mix, weekly weighting, and unit-mix.
- Decision Variables: the numbers of commercials of each spot length requested by the client that are to be placed in the shows and weeks included in the sales plan
- Objective Function: total value of ad slots assigned to the sales plan and the penalties incurred in not meeting the client requirements these systems have provided
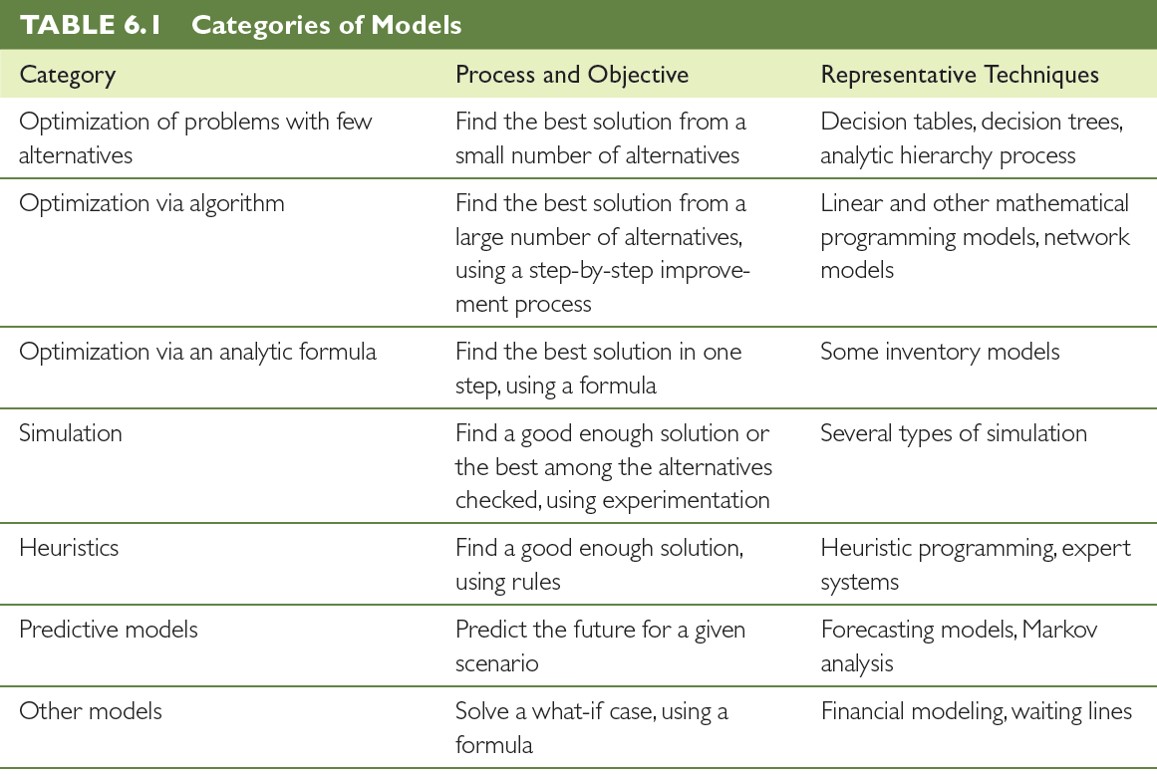
Categories Of Models
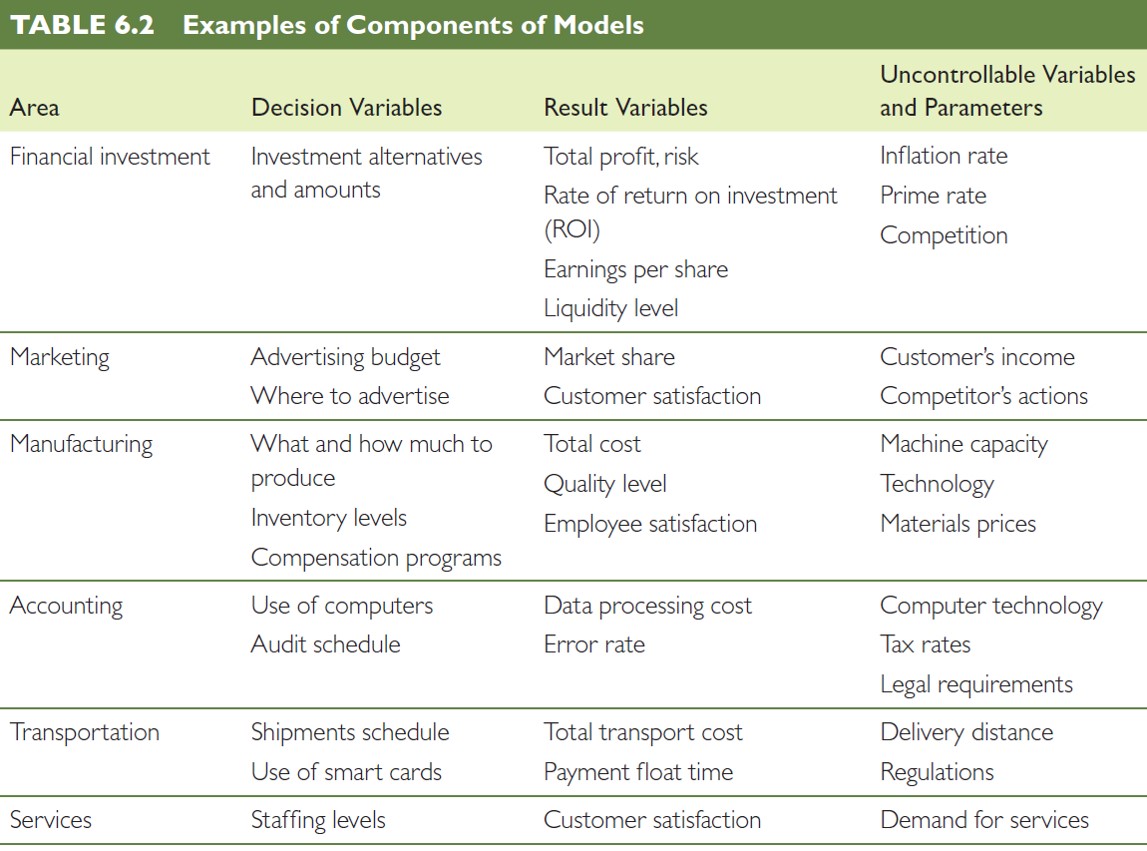
Components Of Models
Optimization Models
- Too Many: Assignment (best matching of objects), Dynamic programming, Goal programming, Investment (maximizing rate of return), Linear and integer programming, Network models for planning and scheduling, Nonlinear programming, Replacement (capital budgeting), Inventory models (e.g., economic order quantity), Transportation (minimize cost of shipments)
- Most of these models are from the discipline Operations Research started in World War II (e.g., reduce the number of anti-aircraft artillery rounds needed to shoot down an enemy aircraft from an average of over 20,000 at the start of the Battle of Britain to 4,000 in 1941)
- Microsoft Excel's Solver is very capable and there are other optimization tools
- Example: Airline Scheduling
Simulation
- "Appearance" of reality
- Conduct experiments with a computer on a comprehensive model of a complex (too complex for numerical optimization) system or problem to assess its dynamic behavior
- Probabilistic Simulation: one or more of the independent variables (e.g., the number of passengers waiting at an airport) follow certain probability distributions
- Monte Carlo Simulation: obtain numerical results through repeated random sampling
- Discrete Event Simulation: model a system where the interaction between different entities is studied, e.g., customer queuing system
- Arena Discrete Event Simulation
- Lots of probability and statistics and respect "Variation, Variation, Variation" in statistics (Example)
Simulation Example using Arena - Airport Security
Answer the following questions from the Category Overview Report on this airport security analysis process simulation from Arena, a discrete event simulation software:- On average, how long did passengers spend in the modeled process?
- What was the average cost of reviewing a passenger's identification?
- What was the longest time a passenger spent in the process?
- What was the maximum number of passengers waiting for identification check?
- What proportion of time was the security officer busy?
6. Emerging Trends
- Data Science and Data Scientist
- Internet of Things (IoT) and Business Analytics
- Cloud Computing and Business Analytics
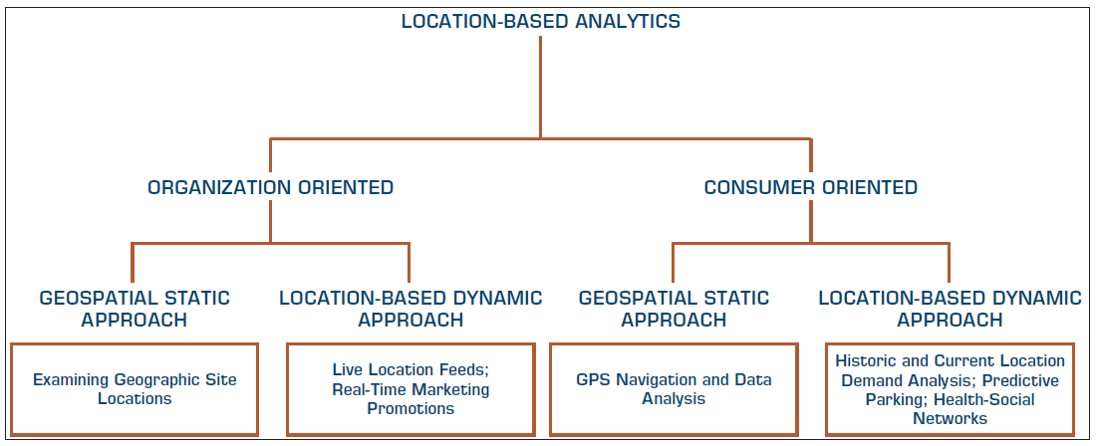
- Location-Based Analytics
Data Science and Data Scientist
- D. J. Patil of LinkedIn credited for creating the term "data science"
- Data scientist responsible for predictive analysis, statistical analysis, and more advanced analytical tools and algorithms (data mining, knowledge discovery, or machine learning)
- Write code for data cleaning/analysis in Web-oriented languages like Java or Python and statistical languages such as R
- Significant expertise in statistics (modeling, designed experiments, analysis), and also in operations research (optimization, simulation, etc.)
- Same knowledge and skills described for Business Analytics
- Computer science, statistics, and applied mathematics programs prefer the data science label but there is no distinction between (business) analytics and data science
Skills That Define a Data Scientist
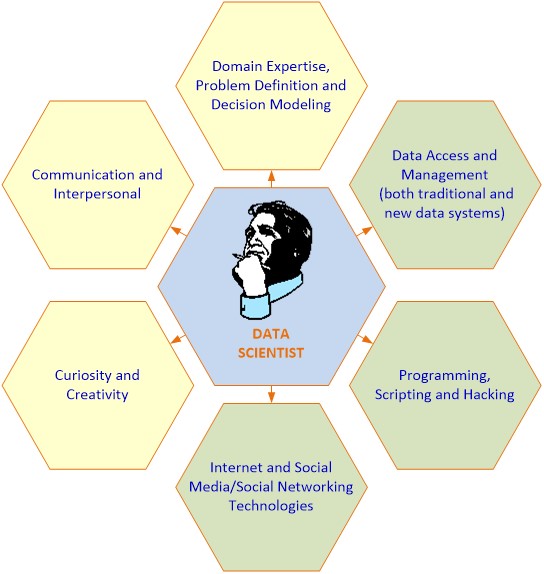
Internet of Things (IoT)
- Internet of Things: Connecting physical world to the Internet, machine-to-machine
- Internet of People: Connecting humans to each other through technology, e.g., facebook, twitter
- Enablers of Internet of Things: sensors and sensing devices
- Examples: Self-driving cars, Fitness trackers, Smartbin ¨C trash detectors detecting fill levels, Smart refrigerators, and other appliances
- By 2020, another 38 billion things will be connected to the Internet
- Help build smart cities, smart cars, smart grid, smart anything
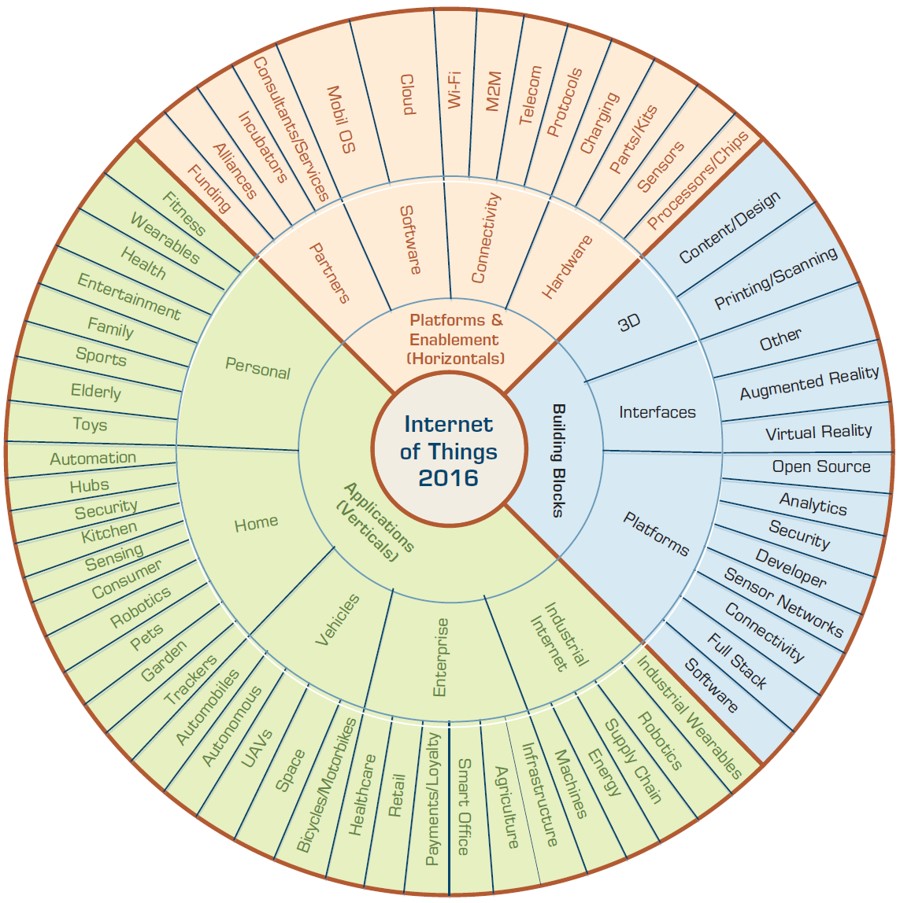
Building Blocks of IoT Technology Infrastructure
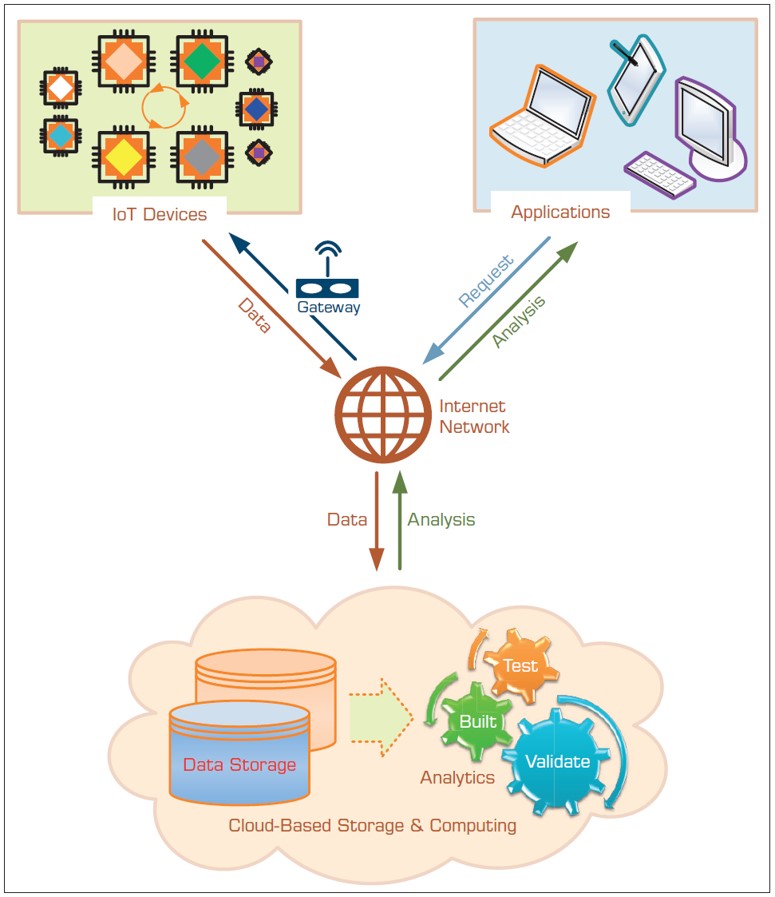
Internet of Things (IoT) Ecosystem
Cloud Computing and Business Analytics
- A style of pay-per-use computing in which dynamically scalable and often virtualized resources are provided over the Internet.
- Users need not have knowledge of, experience in, or control over the technology infrastructures in the cloud that supports them.
- Cloud computing = utility computing, application service provider grid computing, on-demand computing, software-as-a-service (SaaS), etc.
- Cloud computing service companies: Amazon Web Services (AWS), salesforce.com, Microsoft, IBM, Google, etc.
- Analytics as a Service in Cloud: Amazon Elastic Beanstalk, IBM Bluemix, Microsoft Azure, Google App Engine, Red Hat's OpenShift, Teradata - Aster Analytics as a Service, IBM Watson Analytics, MineMyText.com, SAS Visual Analytic and Visual Statistics, Tableau, Showflake, Predix by General Electric
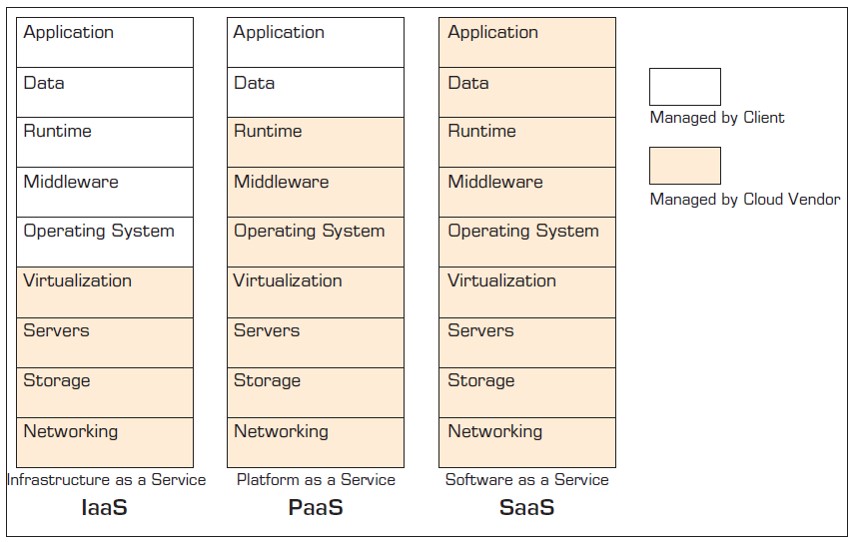
Different Types of Cloud Offerings
Location-Based Analytics